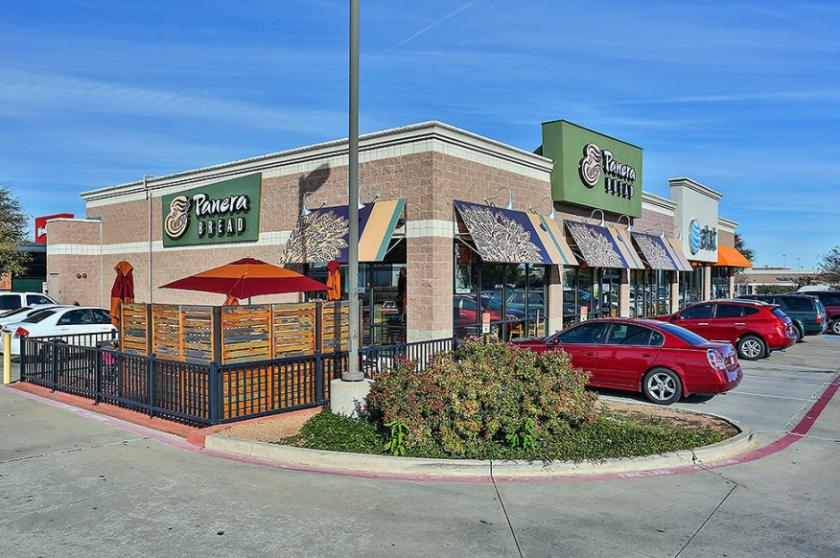
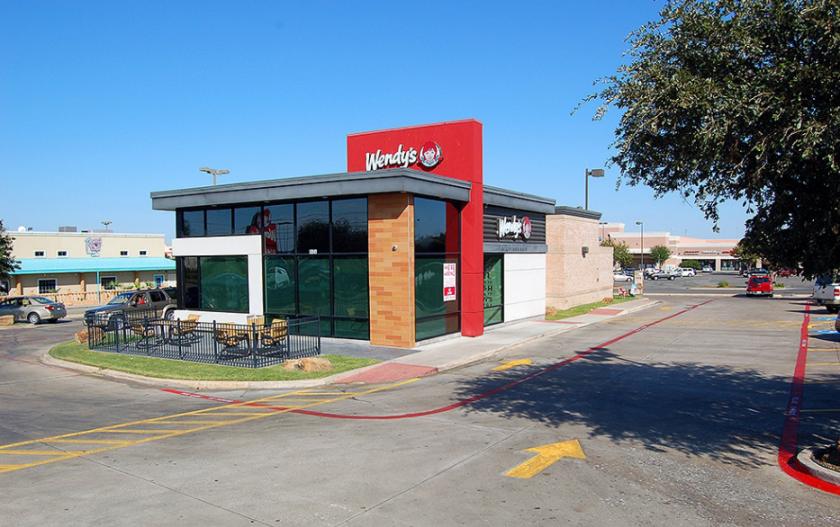
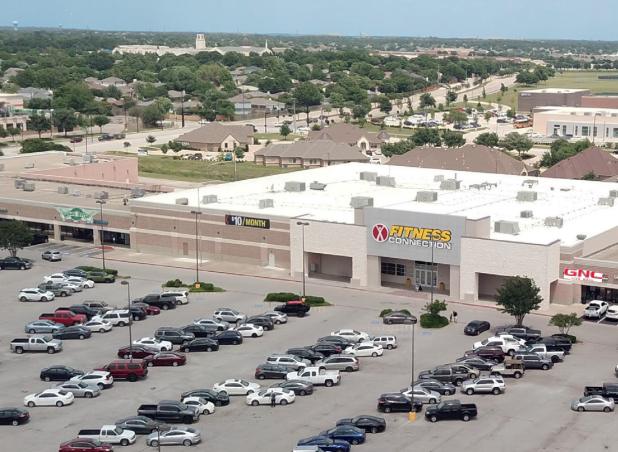
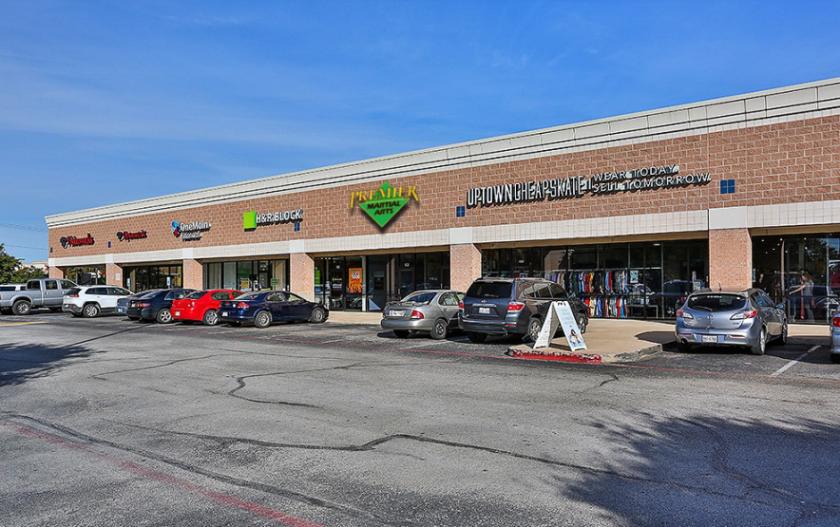
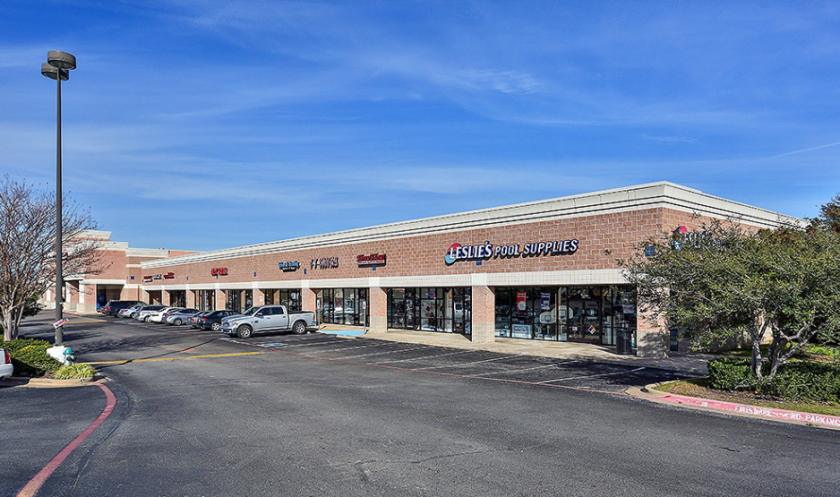
1-Mile | 3-Miles | 5-Miles | ||
---|---|---|---|---|
Total Population | 15,134 | 138,052 | 293,890 | |
Population Median Age | 32 | 34 | 35 | |
Population by Age | 0-9 Yrs | 2598 (17%) | 21021 (15%) | 44106 (15%) |
10-19 Yrs | 2764 (18%) | 22911 (16%) | 44824 (15%) | |
20-29 Yrs | 1825 (12%) | 16398 (11%) | 37750 (12%) | |
30-39 Yrs | 2531 (16%) | 20101 (14%) | 43074 (14%) | |
40-49 Yrs | 2067 (13%) | 20648 (14%) | 42551 (14%) | |
50-59 Yrs | 1934 (12%) | 18754 (13%) | 39053 (13%) | |
60-69 Yrs | 768 (5%) | 10903 (7%) | 24461 (8%) | |
70+ Yrs | 647 (4%) | 7316 (5%) | 18072 (6%) | |
Median HH Income | $87,534 | $88,111 | $85,052 | |
Total Household Income | < 24K | 248 (5%) | 3164 (7%) | 8485 (8%) |
25-49K | 452 (10%) | 6781 (15%) | 16647 (16%) | |
50-74K | 1071 (23%) | 8423 (19%) | 18582 (18%) | |
75-99K | 973 (21%) | 7098 (16%) | 15075 (15%) | |
100-199K | 1571 (34%) | 15199 (34%) | 31165 (31%) | |
200K+ | 202 (4%) | 3516 (7%) | 9598 (9%) | |
Highest Education Level | No Diploma | 646 | 6313 | 13326 |
Diploma or GED | 2169 | 18239 | 38703 | |
Some College | 2478 | 21629 | 45837 | |
Assoc. Degree | 823 | 7689 | 17024 | |
Bachelors Degree | 2151 | 23279 | 51659 | |
Higher Degree | 665 | 9031 | 20898 | |
Total Housing Units | 4,663 | 45,496 | 103,977 | |
--Owner-Occupied | 3,505 | 34,660 | 70,281 | |
--Renter-Occupied | 1,013 | 9,520 | 29,271 | |
Owner-Occupied Values | < 100K | 206 | 3482 | 7039 |
100-199K | 2213 | 15805 | 27907 | |
200-299K | 846 | 8686 | 18886 | |
300-399K | 133 | 4074 | 8746 | |
400-499K | 31 | 1830 | 4184 | |
500K+ | 76 | 783 | 3518 | |
Total Working Age Population | 10,629 | 102,687 | 220,999 | |
In Work Force | 8,030 | 75,284 | 160,945 | |
Not In Work Force | 2,599 | 27,403 | 60,055 | |
Workforce Employed | 7,738 | 71,859 | 153,432 | |
Workforce Unemployed | 286 | 3,381 | 7,241 | |
Civlian Workforce | 8,024 | 75,240 | 160,673 | |
Military Workforce | 6 | 44 | 272 | |
Total Households | 4,518 | 44,180 | 99,552 | |
Family Households | 3,778 | 35,384 | 75,166 | |
Non-Family Households | 739 | 8,796 | 24,386 | |
Married Couple | 3,094 | 27,787 | 58,276 | |
Other Family | 684 | 7,597 | 16,890 | |
Married w/Child | 1,821 | 14,467 | 29,017 | |
Single Male w/Child | 120 | 808 | 2,309 | |
Single Female w/Child | 288 | 3,293 | 7,404 |
Population Change Last Two Decades - Plus Projection
2000 | % | 2010 | % | 2020 | % | 2030 | |
---|---|---|---|---|---|---|---|
Texas | 20,851,820 | +21 | 25,145,561 | +18 | 29,677,668 | +18 | 34,894,452 |
Tarrant County | 1,446,219 | +25 | 1,809,034 | +19 | 2,143,755 | +17 | 2,507,170 |
Total Working Age Population:
Total Households:
Total Working Age Population:
Total Households:
Total Working Age Population:
Total Households: