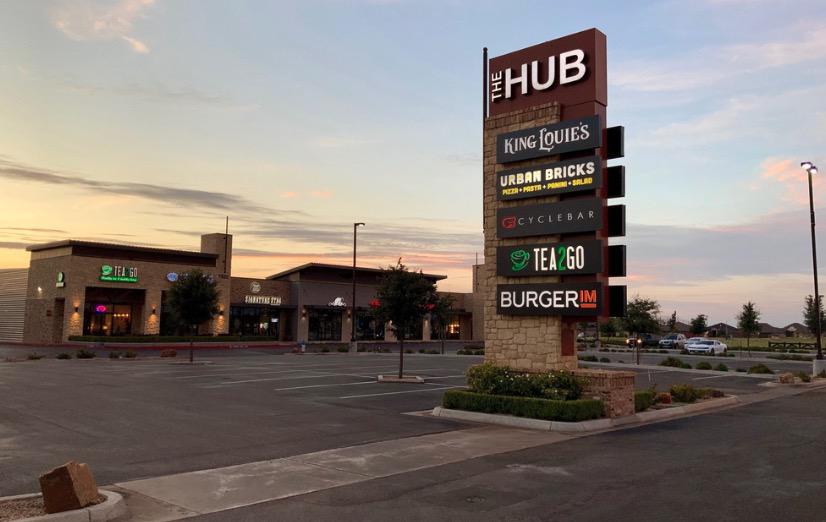
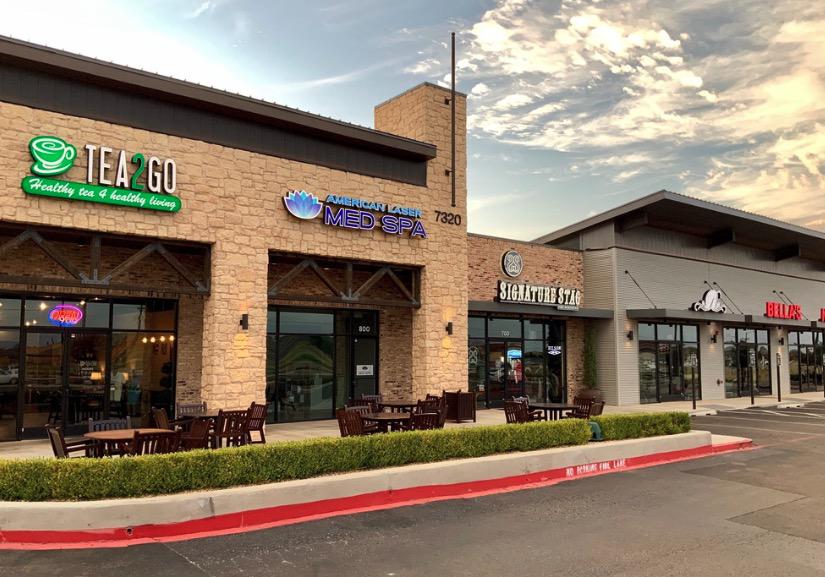
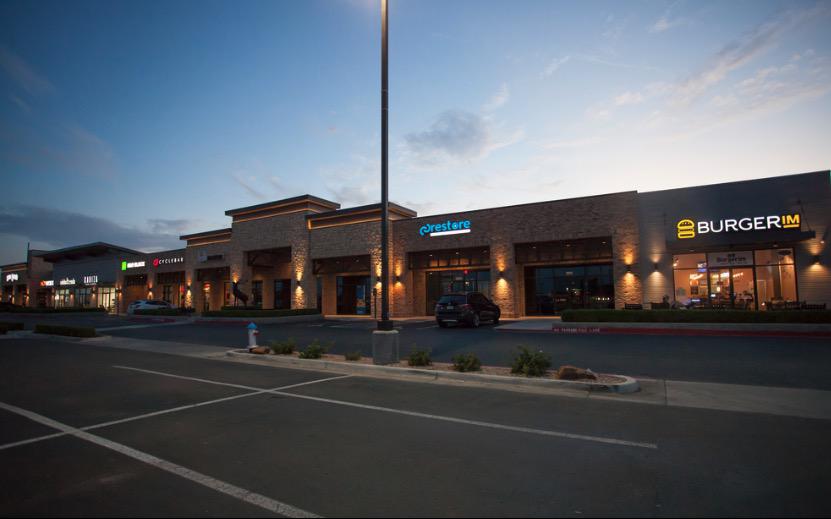
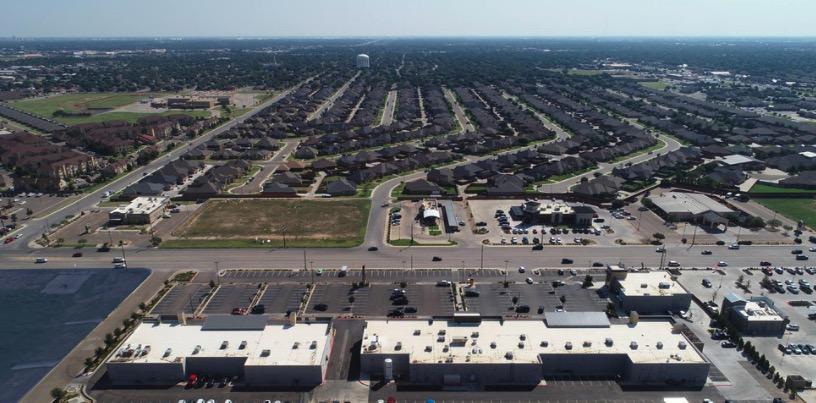
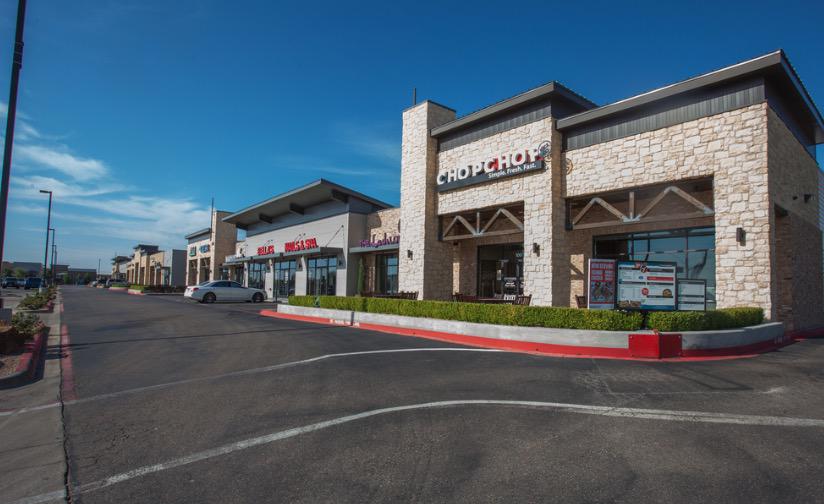
Highlights Space Available - 2,181 sq. ft. and 2,015 sq. ft. (can be combined up to 4,197 sq. ft.) Suitable for Restaurant, Retail or Service Industry Use Located on Lubbock's Most Rapidly Growing Commercial Thoroughfare Ultimate Location * Exceptional Traffic * Effortless Access Co-tenants in the Shopping Center Include Chop Chop Rice Co., Burgerim, Urban Bricks, Verizon, Edward Jones, Kadiza Hair Salon, Tea 2 Go, Signature Stag, Cycle Bar, King Louie's, Hotworx, among othersDescriptionRetail space in a recently-constructed shopping center on Milwaukee Avenue in west Lubbock. Space from 2,015 sq. ft. to 4,197 sq. ft. is available for a wide variety of retail, restaurant, and service industry uses. Traffic along Milwaukee Avenue continues to rapidly grow as development continues along the corridor. North and south bound traffic at 73rd & Milwaukee exceeds that of 57th Street & Slide Road in front of South Plains Mall (City of Lubbock 2015 Traffic Count). Anchored by an 800,000 sq. ft. power center one mile to the north and a Walmart one-half mile to the south, The HUB Shopping Center is strategically located along Lubbock's most rapidly-growing commercial corridor. Current development in the corridor includes single-family residential, retail, restaurant, multi-family, office, financial and automotive. Recent and planned commercial development along Milwaukee Avenue continues to enhance this corridor for local residents, while making it an increasingly popular shopping and dining destination for the more than 640,000 people that utilize Lubbock's offerings as a hub for shopping, dining, entertainment and medical facilities.