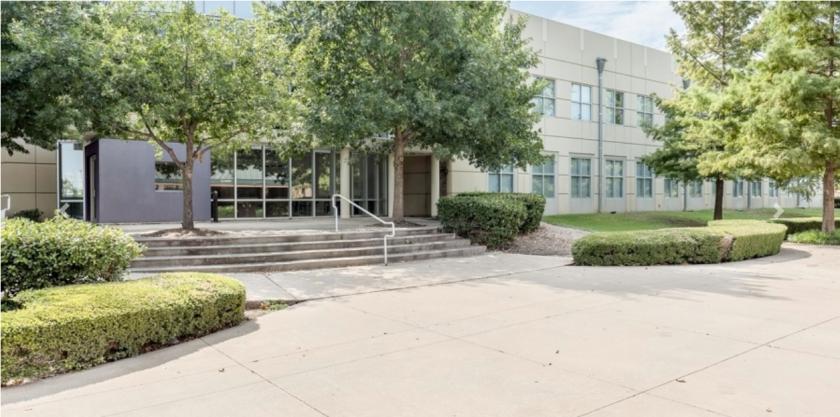
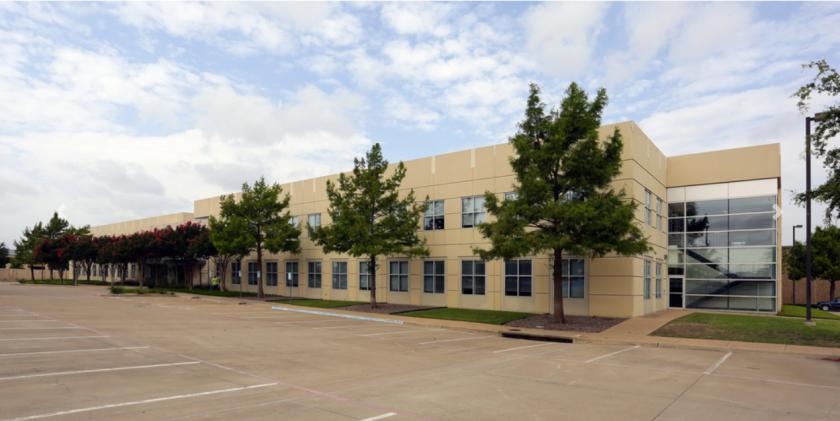
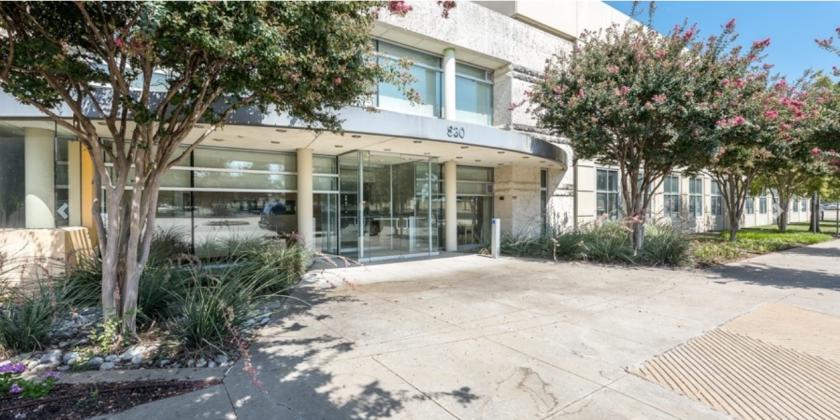
1-Mile | 3-Miles | 5-Miles | ||
---|---|---|---|---|
Total Population | 9,729 | 96,273 | 254,906 | |
Population Median Age | 37 | 36 | 36 | |
Population by Age | 0-9 Yrs | 1222 (12%) | 12580 (13%) | 33962 (13%) |
10-19 Yrs | 1347 (13%) | 14175 (14%) | 39649 (15%) | |
20-29 Yrs | 1436 (14%) | 12950 (13%) | 29767 (11%) | |
30-39 Yrs | 1211 (12%) | 12828 (13%) | 33997 (13%) | |
40-49 Yrs | 1359 (13%) | 15054 (15%) | 42384 (16%) | |
50-59 Yrs | 1395 (14%) | 14079 (14%) | 36112 (14%) | |
60-69 Yrs | 950 (9%) | 8918 (9%) | 23626 (9%) | |
70+ Yrs | 810 (8%) | 5690 (5%) | 15409 (6%) | |
Median HH Income | $73,389 | $93,340 | $96,559 | |
Total Household Income | < 24K | 366 (10%) | 2899 (8%) | 7452 (8%) |
25-49K | 793 (22%) | 5113 (15%) | 12390 (14%) | |
50-74K | 658 (18%) | 5429 (16%) | 14476 (16%) | |
75-99K | 479 (13%) | 4340 (13%) | 10456 (12%) | |
100-199K | 1041 (29%) | 11511 (34%) | 29452 (33%) | |
200K+ | 195 (5%) | 3958 (11%) | 12446 (14%) | |
Highest Education Level | No Diploma | 435 | 3504 | 11397 |
Diploma or GED | 1458 | 10178 | 23673 | |
Some College | 1680 | 13623 | 33192 | |
Assoc. Degree | 540 | 5161 | 12111 | |
Bachelors Degree | 1689 | 20184 | 55348 | |
Higher Degree | 786 | 10734 | 30846 | |
Total Housing Units | 3,710 | 34,623 | 90,801 | |
--Owner-Occupied | 2,162 | 21,545 | 59,028 | |
--Renter-Occupied | 1,369 | 11,706 | 27,644 | |
Owner-Occupied Values | < 100K | 174 | 854 | 2222 |
100-199K | 1045 | 5527 | 12880 | |
200-299K | 616 | 7601 | 18495 | |
300-399K | 215 | 4132 | 13305 | |
400-499K | 65 | 1972 | 6373 | |
500K+ | 48 | 1459 | 5753 | |
Total Working Age Population | 7,722 | 74,972 | 195,985 | |
In Work Force | 5,447 | 54,708 | 140,627 | |
Not In Work Force | 2,275 | 20,264 | 55,358 | |
Workforce Employed | 5,123 | 52,429 | 135,041 | |
Workforce Unemployed | 324 | 2,240 | 5,496 | |
Civlian Workforce | 5,447 | 54,669 | 140,537 | |
Military Workforce | 0 | 39 | 90 | |
Total Households | 3,532 | 33,251 | 86,672 | |
Family Households | 2,477 | 24,848 | 66,448 | |
Non-Family Households | 1,055 | 8,403 | 20,223 | |
Married Couple | 1,960 | 19,918 | 54,386 | |
Other Family | 517 | 4,929 | 12,062 | |
Married w/Child | 953 | 10,441 | 29,020 | |
Single Male w/Child | 0 | 359 | 1,441 | |
Single Female w/Child | 167 | 2,087 | 5,150 |
Population Change Last Two Decades - Plus Projection
2000 | % | 2010 | % | 2020 | % | 2030 | |
---|---|---|---|---|---|---|---|
Texas | 20,851,820 | +21 | 25,145,561 | +18 | 29,677,668 | +18 | 34,894,452 |
Collin County | 491,675 | +59 | 782,341 | +33 | 1,039,369 | +34 | 1,391,461 |
Total Working Age Population:
Total Households:
Total Working Age Population:
Total Households:
Total Working Age Population:
Total Households: