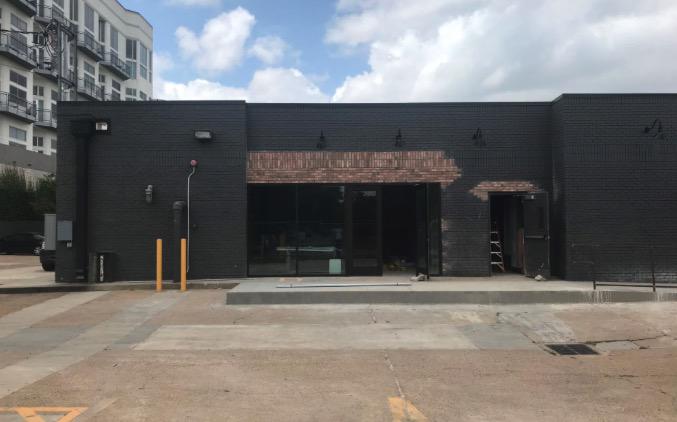
1-Mile | 3-Miles | 5-Miles | ||
---|---|---|---|---|
Total Population | 31,146 | 168,883 | 425,174 | |
Population Median Age | 40 | 38 | 37 | |
Population by Age | 0-9 Yrs | 1856 (5%) | 13530 (8%) | 42077 (9%) |
10-19 Yrs | 1231 (3%) | 11157 (6%) | 37083 (8%) | |
20-29 Yrs | 6949 (22%) | 40423 (23%) | 91374 (21%) | |
30-39 Yrs | 7174 (23%) | 34779 (20%) | 80405 (18%) | |
40-49 Yrs | 4554 (14%) | 22208 (13%) | 54966 (12%) | |
50-59 Yrs | 4125 (13%) | 19330 (11%) | 48710 (11%) | |
60-69 Yrs | 3492 (11%) | 16752 (9%) | 40245 (9%) | |
70+ Yrs | 1765 (5%) | 10704 (6%) | 30315 (7%) | |
Median HH Income | $88,769 | $95,038 | $79,389 | |
Total Household Income | < 24K | 2414 (13%) | 12470 (14%) | 35151 (18%) |
25-49K | 2628 (14%) | 10102 (12%) | 29119 (15%) | |
50-74K | 2762 (15%) | 11815 (14%) | 27238 (14%) | |
75-99K | 2004 (11%) | 9219 (11%) | 19814 (10%) | |
100-199K | 4539 (25%) | 21638 (25%) | 43018 (22%) | |
200K+ | 3469 (19%) | 18309 (21%) | 35635 (18%) | |
Highest Education Level | No Diploma | 823 | 6372 | 30887 |
Diploma or GED | 1643 | 10393 | 37228 | |
Some College | 3607 | 16129 | 43833 | |
Assoc. Degree | 1038 | 5055 | 13341 | |
Bachelors Degree | 9494 | 47145 | 96362 | |
Higher Degree | 9024 | 43439 | 86580 | |
Total Housing Units | 20,176 | 96,735 | 220,036 | |
--Owner-Occupied | 7,039 | 35,107 | 83,671 | |
--Renter-Occupied | 10,777 | 48,446 | 106,305 | |
Owner-Occupied Values | < 100K | 170 | 1371 | 8984 |
100-199K | 535 | 2778 | 10199 | |
200-299K | 764 | 4363 | 9992 | |
300-399K | 1134 | 6403 | 12671 | |
400-499K | 1364 | 5325 | 10083 | |
500K+ | 3071 | 14868 | 31741 | |
Total Working Age Population | 28,516 | 149,786 | 362,918 | |
In Work Force | 23,129 | 110,068 | 251,642 | |
Not In Work Force | 5,387 | 39,718 | 111,276 | |
Workforce Employed | 22,407 | 106,252 | 240,352 | |
Workforce Unemployed | 722 | 3,783 | 11,210 | |
Civlian Workforce | 23,129 | 110,036 | 251,562 | |
Military Workforce | 0 | 32 | 81 | |
Total Households | 17,816 | 83,553 | 189,975 | |
Family Households | 5,750 | 33,282 | 88,864 | |
Non-Family Households | 12,066 | 50,271 | 101,111 | |
Married Couple | 4,754 | 26,644 | 65,715 | |
Other Family | 996 | 6,639 | 23,148 | |
Married w/Child | 1,096 | 8,164 | 23,898 | |
Single Male w/Child | 133 | 762 | 2,132 | |
Single Female w/Child | 319 | 2,240 | 8,457 |
Population Change Last Two Decades - Plus Projection
2000 | % | 2010 | % | 2020 | % | 2030 | |
---|---|---|---|---|---|---|---|
Texas | 20,851,820 | +21 | 25,145,561 | +18 | 29,677,668 | +18 | 34,894,452 |
Harris County | 3,400,578 | +20 | 4,092,459 | +22 | 4,978,845 | +19 | 5,924,750 |
Total Working Age Population:
Total Households:
Total Working Age Population:
Total Households:
Total Working Age Population:
Total Households: