Retail Space
13819 San Pedro Ave San Antonio, TX 78216
13819 San Pedro Ave San Antonio, TX 78216

Details & Description
Property Highlights
• NC Submarket – Prime location on Hwy 281 / San Pedro in the Hill Country Village area of San Antonio, Texas
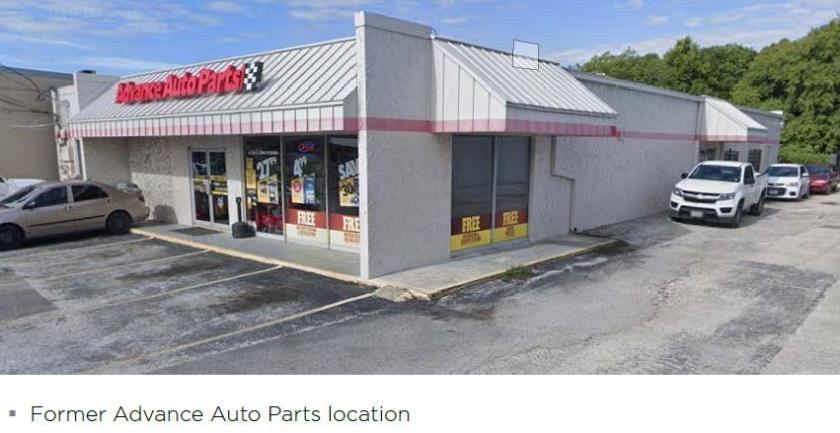
• Former Advance Auto Parts store location
Additional Photos


Listing Agents

Pete Tassos
O: 210-341-9292
ptassos@sullivansa.com
O: 210-341-9292
ptassos@sullivansa.com
While we strive to provide the most accurate information, all listing information, and demographic data, is provided by third-parties. As such, MyEListing will not be responsible for the accuracy of the information. It is strongly recommended that you verify all information with the listing agent, and any relevant agencies, prior to making any decisions.


