Office Space
3000 E Cesar Chavez Austin, TX 78702
3000 E Cesar Chavez Austin, TX 78702

Details & Description
Property Highlights
• Flexible sublease term through October 31, 2024, longer term available through direct lease with the Landlord
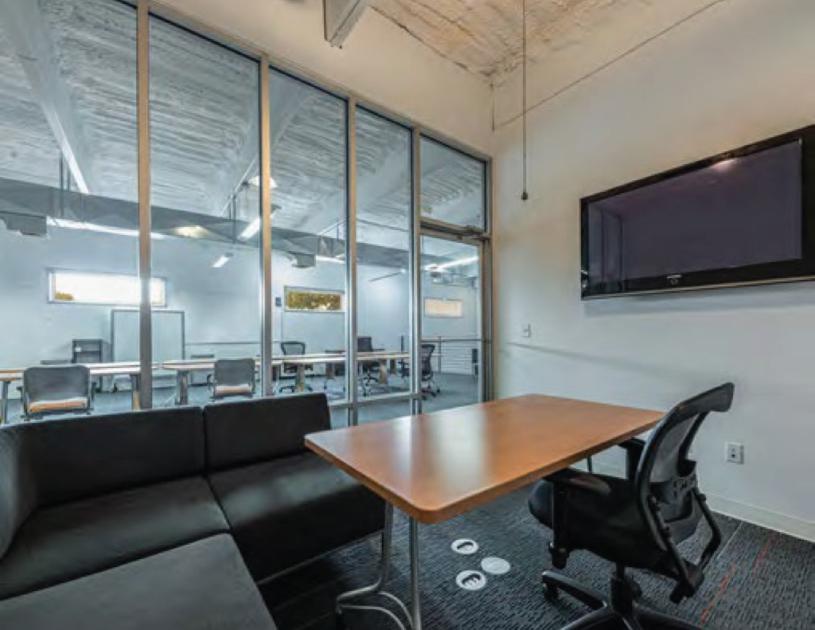
• Primarily open bullpen area with a few exterior offices / conference rooms
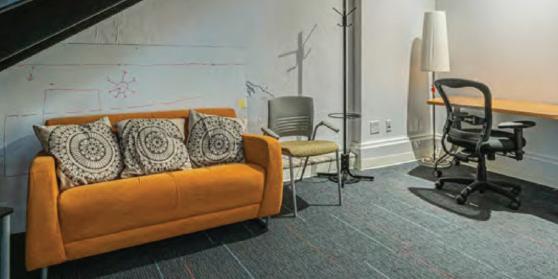
Additional Photos

Listing Agents

Rick Lange
M: 512-538-2092
rlange@hpitx.com
M: 512-538-2092
rlange@hpitx.com
While we strive to provide the most accurate information, all listing information, and demographic data, is provided by third-parties. As such, MyEListing will not be responsible for the accuracy of the information. It is strongly recommended that you verify all information with the listing agent, and any relevant agencies, prior to making any decisions.


