Industrial Properties
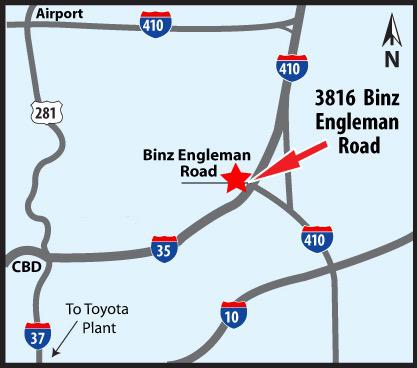
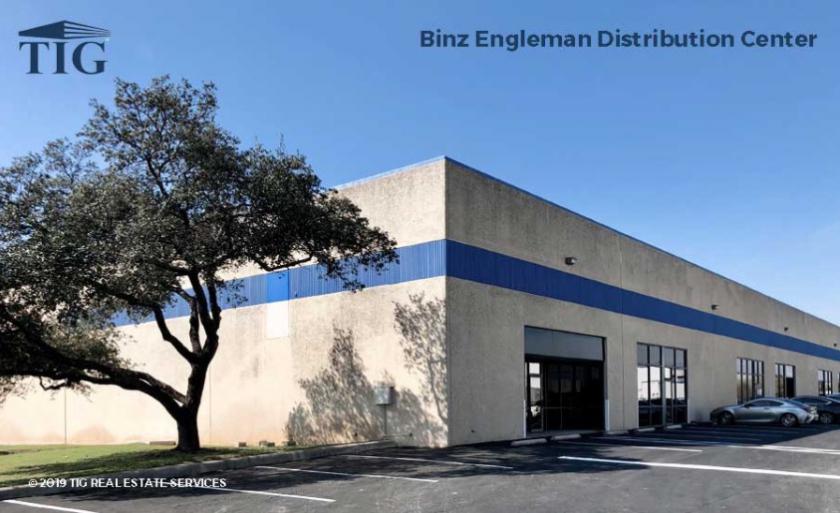
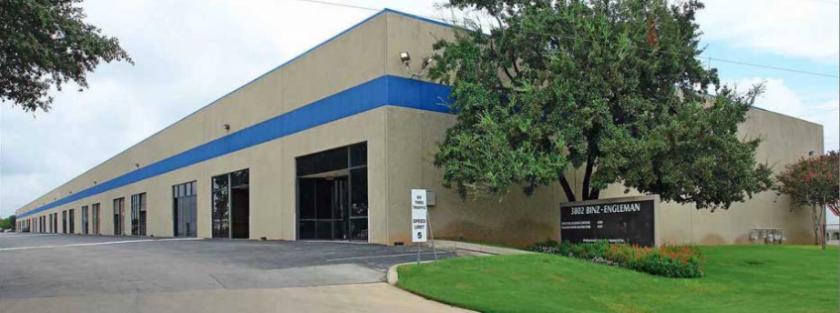
3816 Binz Engleman Rd San Antonio, TX 78219
3816 Binz Engleman Rd San Antonio, TX 78219
Details & Description
Listing Agents

David Alsmeyer
O: 512-901-0181
dalsmeyer@tigusa.com
O: 512-901-0181
dalsmeyer@tigusa.com
While we strive to provide the most accurate information, all listing information, and demographic data, is provided by third-parties. As such, MyEListing will not be responsible for the accuracy of the information. It is strongly recommended that you verify all information with the listing agent, and any relevant agencies, prior to making any decisions.