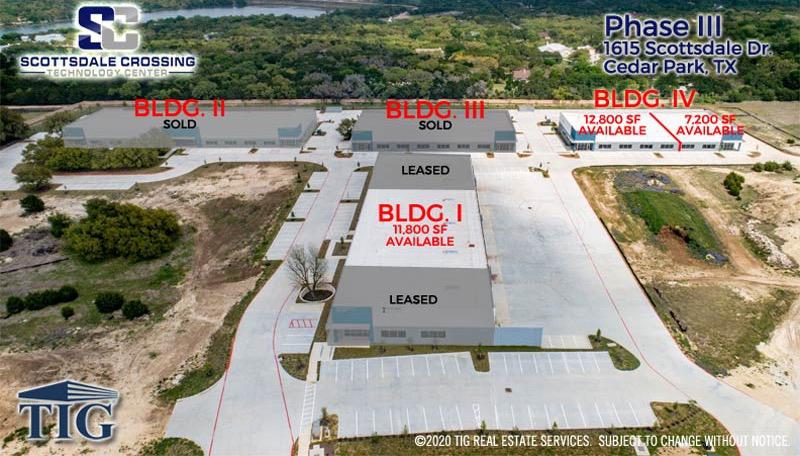
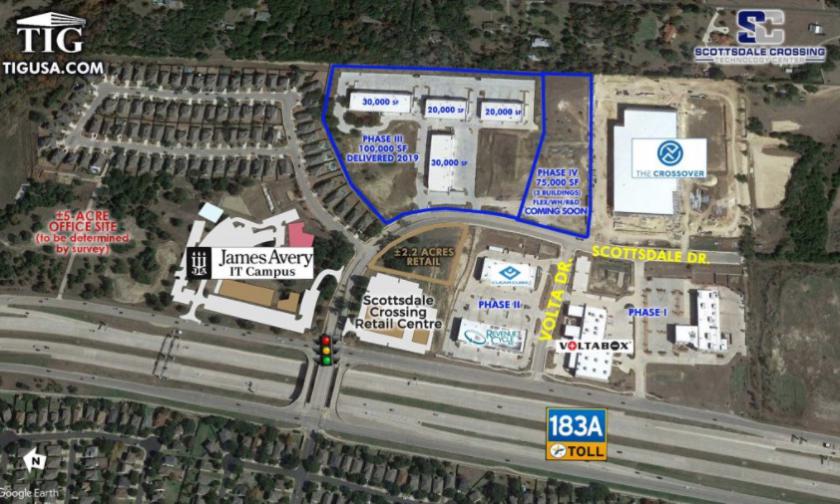
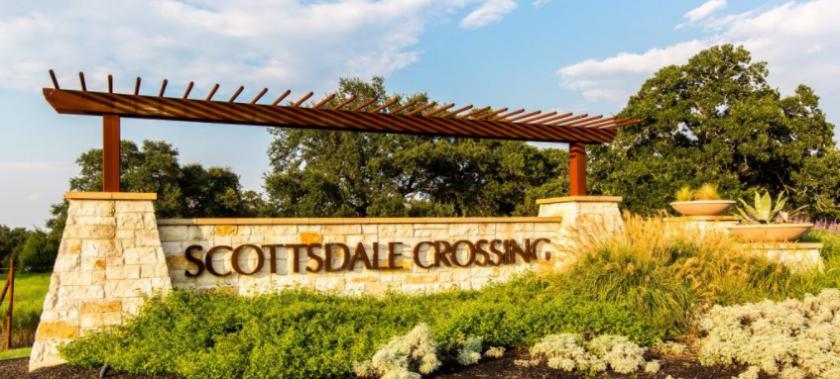
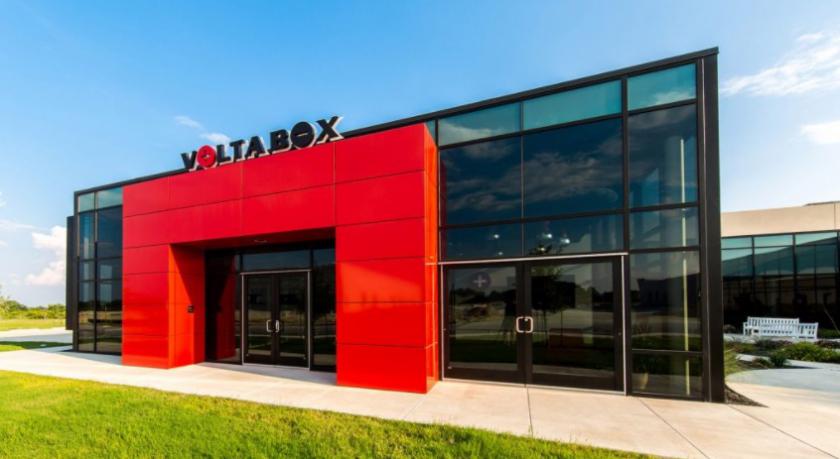
PROPERTY HIGHLIGHTSJoin Cedar Park’s newest mixed-use tech hub. Scottsdale Crossing is a master-planned, 120-acre, deed-restricted development offering over 640,000 SF of office and flex buildings, retail and restaurant space and over 80 single-family lots. Located near the Cedar Park Regional Medical Center and HEB Event Center, the development has over one-half mile of frontage on US 183A and is directly accessed from US 183A via Scottsdale Road exit. It is the only site north of New Hope Road in Cedar Park with east/west access across US 183A. Benefits include City of Cedar Park incentives (call for details), Triple Freeport tax exemption, and low-impact, xeriscaped landscaping, and easy access. Scottsdale Crossing is the new home of Revenue Cycle, Inc.; Voltabox US; Waterfall Gourmet Beverages, Clear Cube; iSport Crossover Athletic Center. Many restaurants and retailers are within a five-minute drive, including those at 1890 Ranch, Cedar Park Towne Centre, The Parke, and The Railyard.In January, 2020, Waterfall Gourmet Beverages purchased a 25,000-square-foot building in Phase III to house their national headquarters. James Avery Craftsman will be breaking ground for its 42,000-square-foot mixed use campus in Spring/Summer, 2020. The 220,000-square-foot Crossover (iSports) Sports complex, which is now under construction, is scheduled to open in Summer, 2020. A ±20,000-square-foot retail center is underway on a retail site facing the 183A service road at the signalized intersection with Scottsdale Drive. Red Horn Brewery and Coffee House will open a second location at Scottsdale Crossing in the latter half of 2020 and Hill Country Electric is planning to move into their new space in Phase III in Summer, 2020.PHASE III BUILDINGS AVAILABLE FOR SALE OR LEASE:Building I – 11,800 SF available for leaseBuilding IV – 20,000 SF building of which 7,200 SF finished as office; for sale or lease