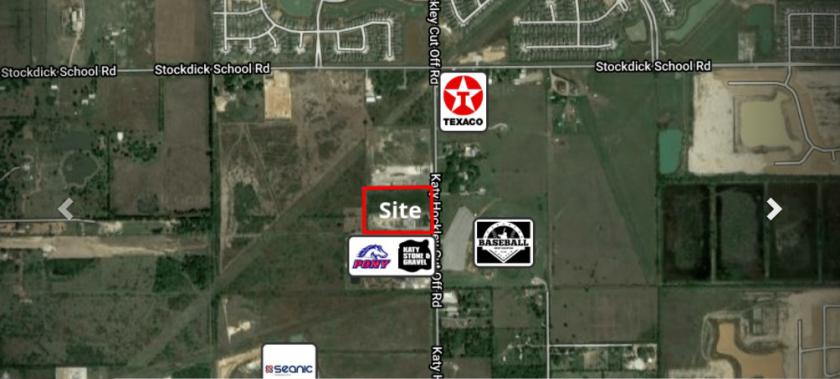
1-Mile | 3-Miles | 5-Miles | ||
---|---|---|---|---|
Total Population | 1,429 | 28,696 | 100,429 | |
Population Median Age | 36 | 33 | 33 | |
Population by Age | 0-9 Yrs | 229 (16%) | 5095 (17%) | 16243 (16%) |
10-19 Yrs | 174 (12%) | 3993 (13%) | 16131 (16%) | |
20-29 Yrs | 160 (11%) | 3671 (12%) | 12566 (12%) | |
30-39 Yrs | 288 (20%) | 4986 (17%) | 17445 (17%) | |
40-49 Yrs | 166 (11%) | 3726 (12%) | 14806 (14%) | |
50-59 Yrs | 161 (11%) | 3516 (12%) | 11408 (11%) | |
60-69 Yrs | 145 (10%) | 2256 (7%) | 7142 (7%) | |
70+ Yrs | 104 (7%) | 1454 (5%) | 4687 (4%) | |
Median HH Income | $99,887 | $93,747 | $87,320 | |
Total Household Income | < 24K | 51 (11%) | 664 (7%) | 2516 (8%) |
25-49K | 46 (10%) | 1138 (13%) | 4987 (16%) | |
50-74K | 55 (12%) | 1494 (17%) | 5585 (18%) | |
75-99K | 70 (15%) | 1341 (15%) | 4561 (14%) | |
100-199K | 191 (43%) | 3415 (39%) | 10468 (34%) | |
200K+ | 30 (6%) | 551 (6%) | 2555 (8%) | |
Highest Education Level | No Diploma | 52 | 1659 | 6241 |
Diploma or GED | 264 | 4471 | 13865 | |
Some College | 207 | 4181 | 15214 | |
Assoc. Degree | 97 | 1658 | 5489 | |
Bachelors Degree | 219 | 3890 | 14619 | |
Higher Degree | 123 | 2294 | 7295 | |
Total Housing Units | 453 | 9,052 | 32,269 | |
--Owner-Occupied | 366 | 6,917 | 21,721 | |
--Renter-Occupied | 76 | 1,686 | 8,951 | |
Owner-Occupied Values | < 100K | 47 | 691 | 1906 |
100-199K | 130 | 3095 | 10738 | |
200-299K | 122 | 2069 | 5694 | |
300-399K | 29 | 607 | 1826 | |
400-499K | 8 | 183 | 741 | |
500K+ | 30 | 272 | 816 | |
Total Working Age Population | 1,089 | 21,088 | 73,832 | |
In Work Force | 769 | 15,706 | 54,349 | |
Not In Work Force | 320 | 5,381 | 19,483 | |
Workforce Employed | 750 | 14,950 | 51,399 | |
Workforce Unemployed | 19 | 725 | 2,820 | |
Civlian Workforce | 769 | 15,675 | 54,220 | |
Military Workforce | 0 | 32 | 130 | |
Total Households | 442 | 8,602 | 30,672 | |
Family Households | 360 | 7,180 | 24,530 | |
Non-Family Households | 82 | 1,423 | 6,142 | |
Married Couple | 298 | 5,799 | 19,255 | |
Other Family | 62 | 1,381 | 5,276 | |
Married w/Child | 154 | 3,182 | 10,811 | |
Single Male w/Child | 10 | 273 | 669 | |
Single Female w/Child | 28 | 436 | 1,990 |
Population Change Last Two Decades - Plus Projection
2000 | % | 2010 | % | 2020 | % | 2030 | |
---|---|---|---|---|---|---|---|
Texas | 20,851,820 | +21 | 25,145,561 | +18 | 29,677,668 | +18 | 34,894,452 |
Fort Bend County | 354,452 | +65 | 585,375 | +44 | 840,383 | +43 | 1,203,029 |
Harris County | 3,400,578 | +20 | 4,092,459 | +22 | 4,978,845 | +19 | 5,924,750 |
Waller County | 32,663 | +32 | 43,205 | +17 | 50,731 | +16 | 59,021 |
Total Working Age Population:
Total Households:
Total Working Age Population:
Total Households:
Total Working Age Population:
Total Households: