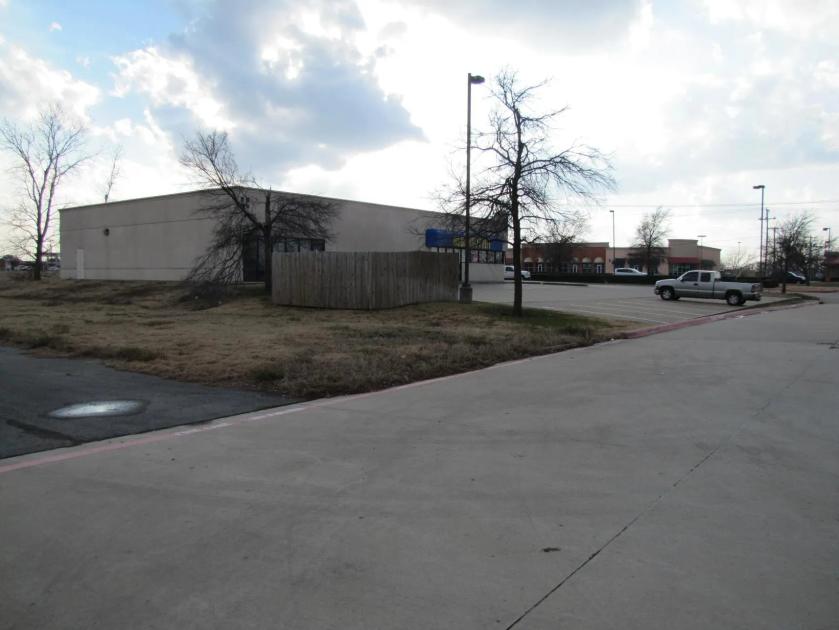
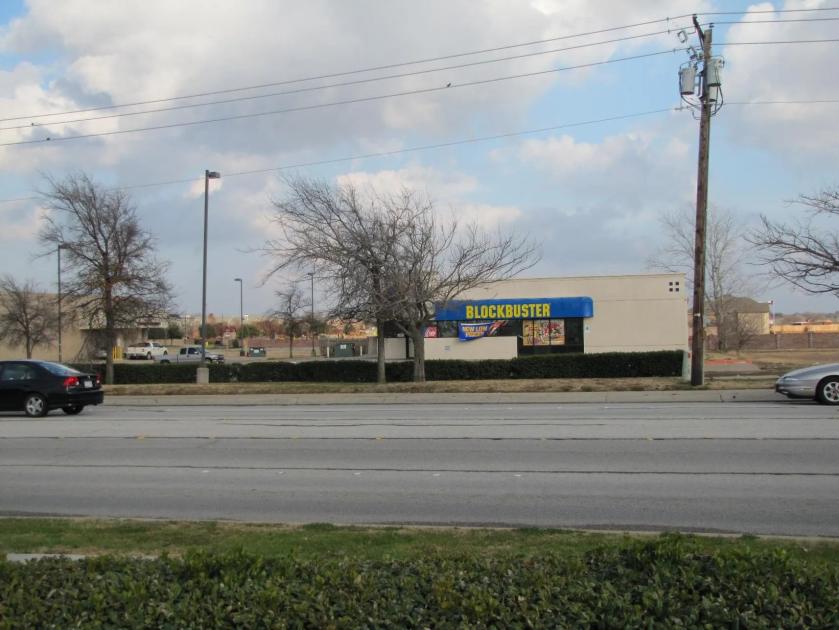
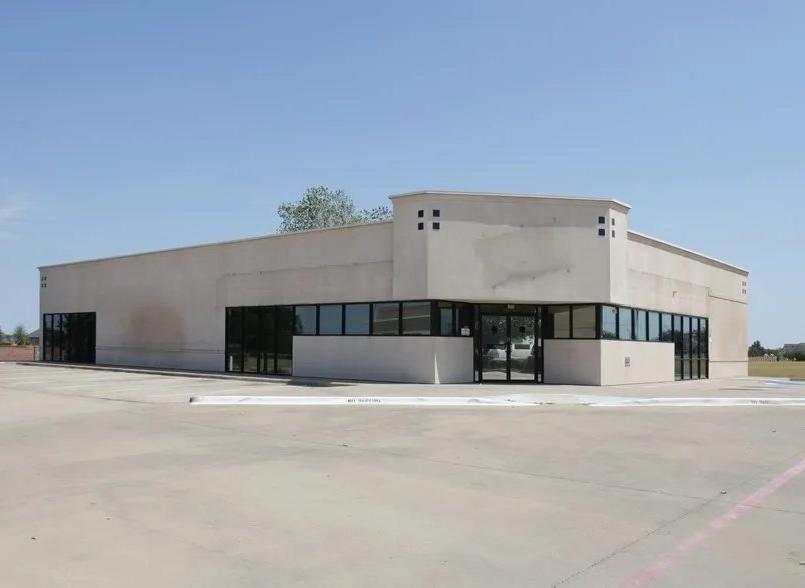
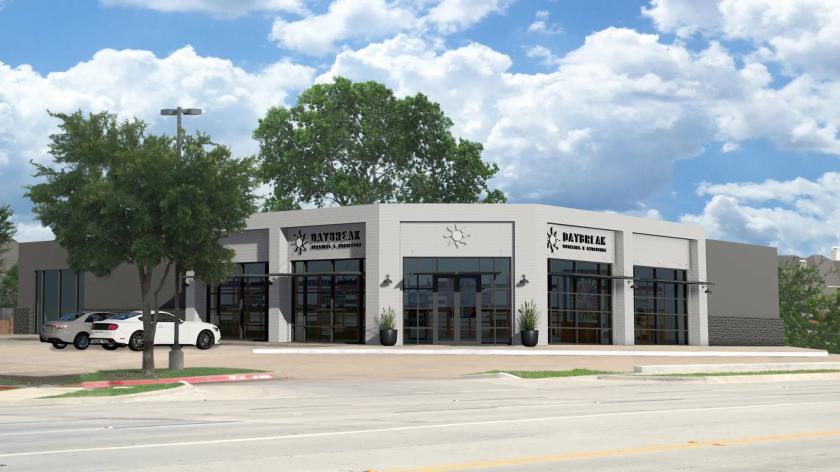
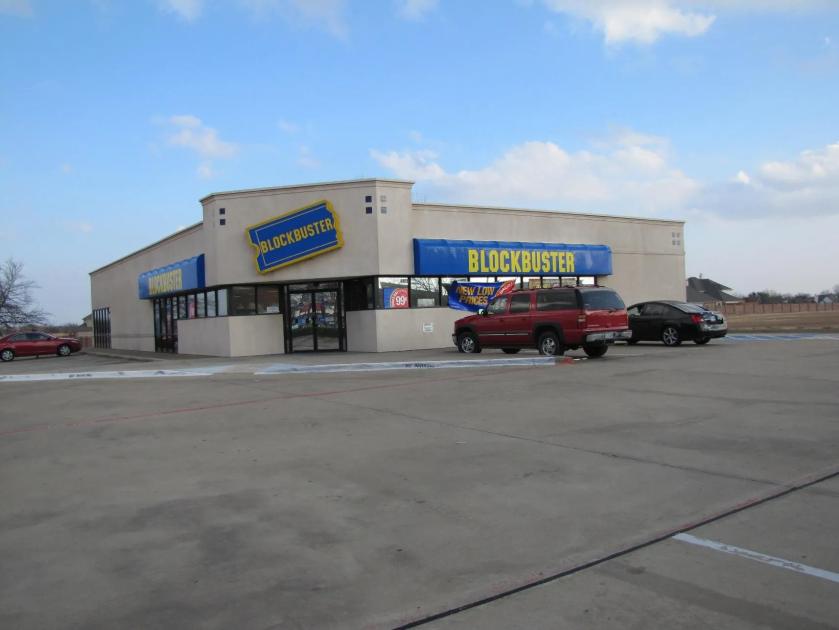
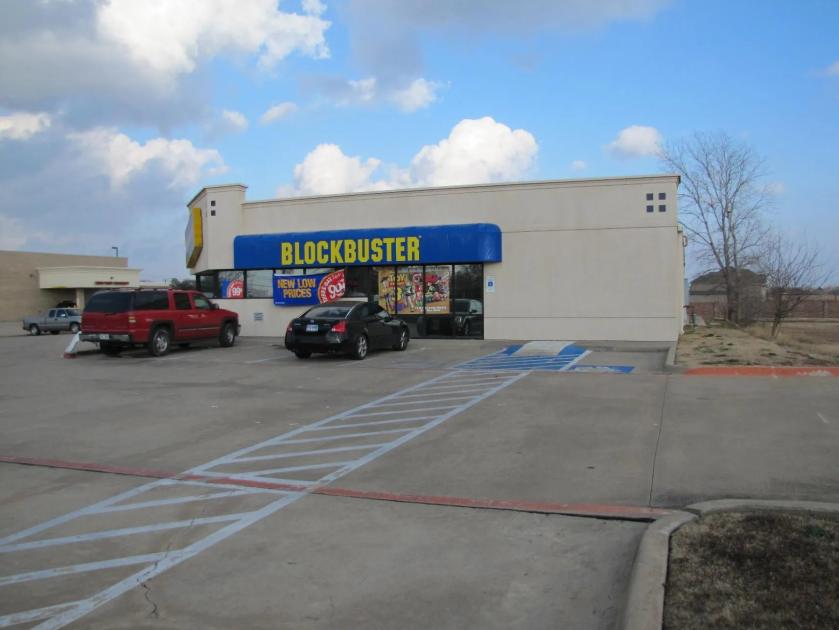
1-Mile | 3-Miles | 5-Miles | ||
---|---|---|---|---|
Total Population | 17,328 | 127,933 | 298,667 | |
Population Median Age | 37 | 36 | 36 | |
Population by Age | 0-9 Yrs | 2295 (13%) | 17951 (14%) | 43051 (14%) |
10-19 Yrs | 2577 (14%) | 19540 (15%) | 43896 (14%) | |
20-29 Yrs | 2264 (13%) | 16395 (12%) | 38721 (12%) | |
30-39 Yrs | 2460 (14%) | 17267 (13%) | 41254 (13%) | |
40-49 Yrs | 2277 (13%) | 17804 (13%) | 41510 (13%) | |
50-59 Yrs | 2207 (12%) | 17827 (13%) | 40548 (13%) | |
60-69 Yrs | 2038 (11%) | 12125 (9%) | 27614 (9%) | |
70+ Yrs | 1211 (6%) | 9024 (7%) | 22072 (7%) | |
Median HH Income | $70,940 | $77,585 | $78,853 | |
Total Household Income | < 24K | 492 (8%) | 3921 (9%) | 10132 (9%) |
25-49K | 1187 (19%) | 8260 (19%) | 19079 (18%) | |
50-74K | 1589 (26%) | 8844 (20%) | 19921 (19%) | |
75-99K | 1094 (18%) | 6812 (15%) | 14777 (14%) | |
100-199K | 1460 (24%) | 12654 (29%) | 29559 (28%) | |
200K+ | 188 (3%) | 2968 (6%) | 9352 (9%) | |
Highest Education Level | No Diploma | 1181 | 7078 | 16500 |
Diploma or GED | 3104 | 19354 | 42802 | |
Some College | 3383 | 21819 | 47214 | |
Assoc. Degree | 978 | 6956 | 16697 | |
Bachelors Degree | 2074 | 19605 | 49430 | |
Higher Degree | 670 | 7665 | 20427 | |
Total Housing Units | 6,129 | 45,270 | 108,026 | |
--Owner-Occupied | 4,558 | 31,747 | 71,221 | |
--Renter-Occupied | 1,452 | 11,710 | 31,599 | |
Owner-Occupied Values | < 100K | 834 | 4169 | 8420 |
100-199K | 2938 | 15163 | 29652 | |
200-299K | 466 | 7425 | 16761 | |
300-399K | 253 | 2919 | 8160 | |
400-499K | 23 | 1424 | 4400 | |
500K+ | 45 | 647 | 3829 | |
Total Working Age Population | 13,499 | 97,650 | 227,577 | |
In Work Force | 9,516 | 69,598 | 162,119 | |
Not In Work Force | 3,983 | 28,052 | 65,458 | |
Workforce Employed | 9,135 | 66,196 | 154,653 | |
Workforce Unemployed | 374 | 3,350 | 7,298 | |
Civlian Workforce | 9,510 | 69,546 | 161,952 | |
Military Workforce | 6 | 52 | 167 | |
Total Households | 6,010 | 43,458 | 102,821 | |
Family Households | 4,573 | 33,244 | 76,620 | |
Non-Family Households | 1,437 | 10,214 | 26,201 | |
Married Couple | 3,408 | 25,646 | 59,044 | |
Other Family | 1,164 | 7,598 | 17,576 | |
Married w/Child | 1,435 | 11,350 | 26,955 | |
Single Male w/Child | 153 | 901 | 2,518 | |
Single Female w/Child | 506 | 3,389 | 7,670 |
Population Change Last Two Decades - Plus Projection
2000 | % | 2010 | % | 2020 | % | 2030 | |
---|---|---|---|---|---|---|---|
Texas | 20,851,820 | +21 | 25,145,561 | +18 | 29,677,668 | +18 | 34,894,452 |
Tarrant County | 1,446,219 | +25 | 1,809,034 | +19 | 2,143,755 | +17 | 2,507,170 |
Total Working Age Population:
Total Households:
Total Working Age Population:
Total Households:
Total Working Age Population:
Total Households: