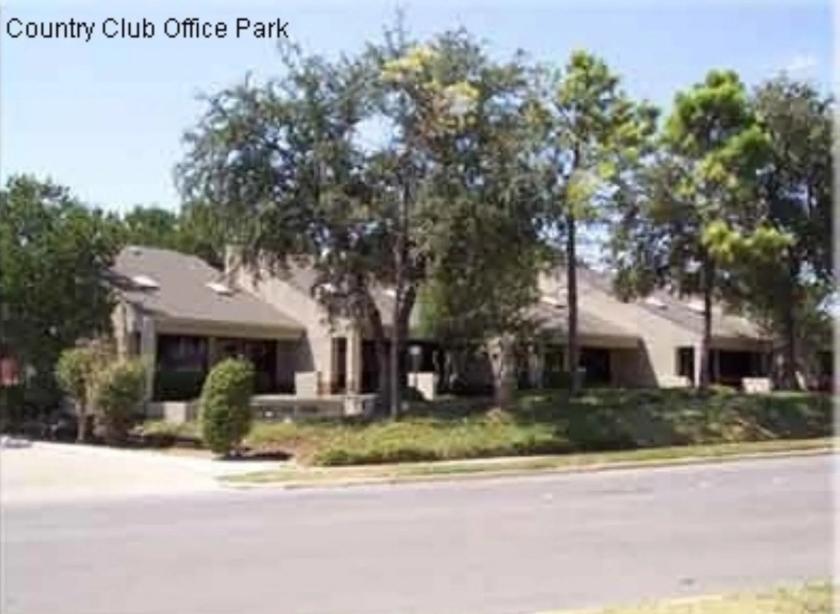
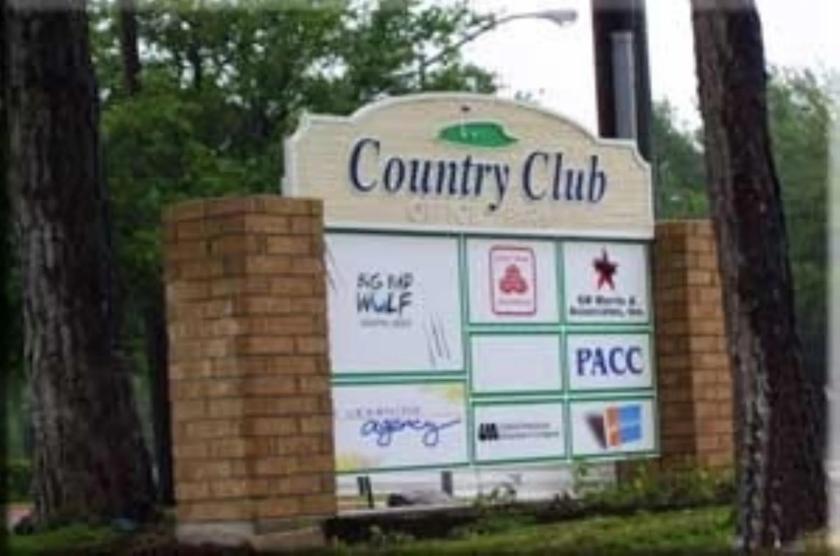
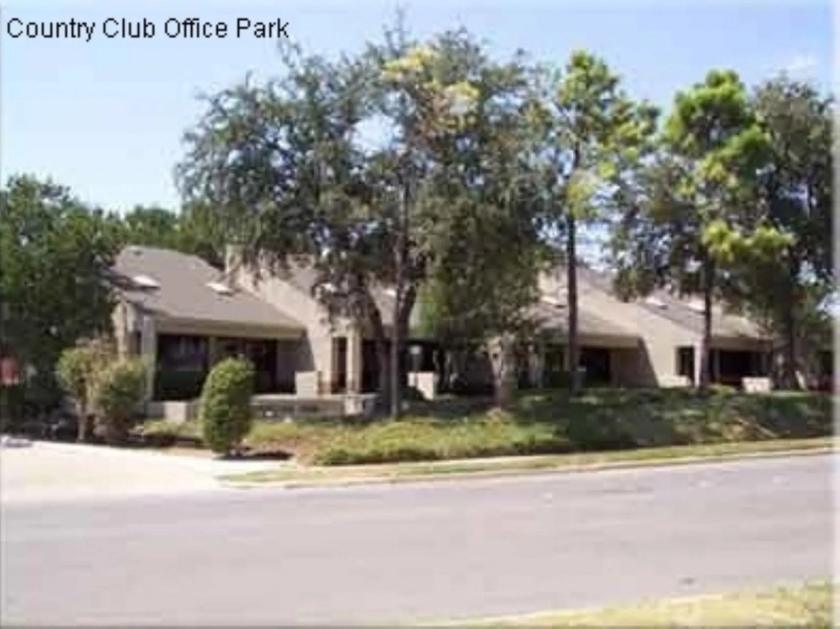
Office Space
1166 Country Club Ln Fort Worth, TX 76112
1166 Country Club Ln Fort Worth, TX 76112
Details & Description
Property Highlights
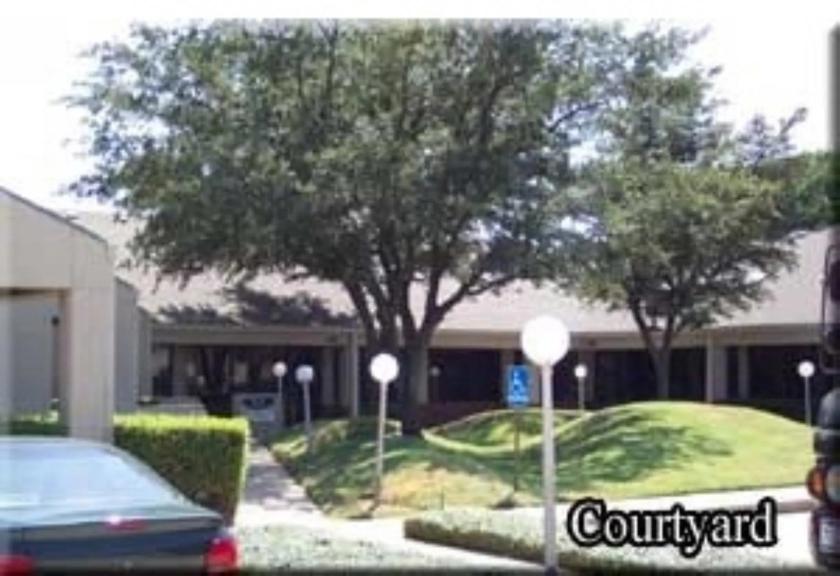
- • Beautiful Garden Office Complex with Courtyard
- • Ten minutes from downtown Fort Worth
- • Ample free parking
- • Skylights throughout lease spaces
Additional Photos

Listing Agents

Clint Montgomery
M: 817-288-5544
clint.montgomery@svn.com
M: 817-288-5544
clint.montgomery@svn.com
While we strive to provide the most accurate information, all listing information, and demographic data, is provided by third-parties. As such, MyEListing will not be responsible for the accuracy of the information. It is strongly recommended that you verify all information with the listing agent, and any relevant agencies, prior to making any decisions.


