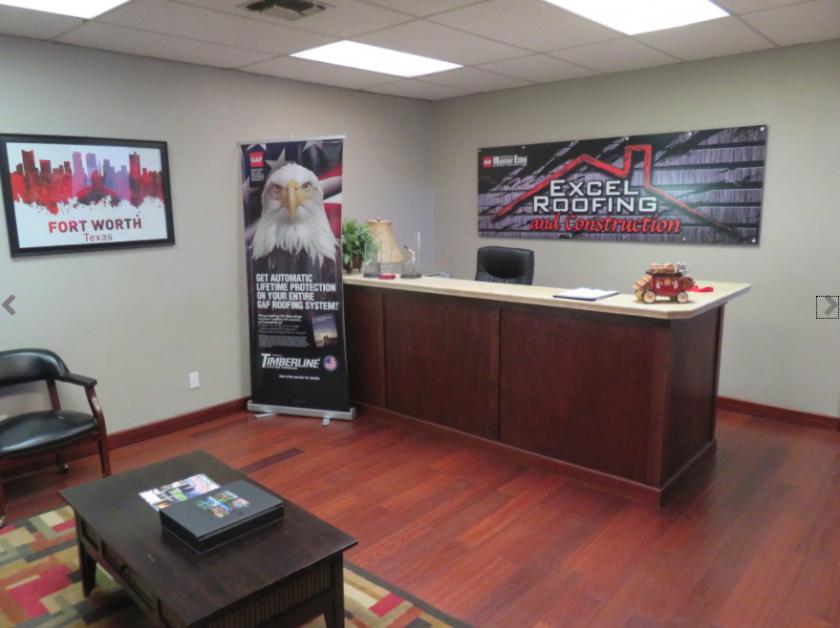
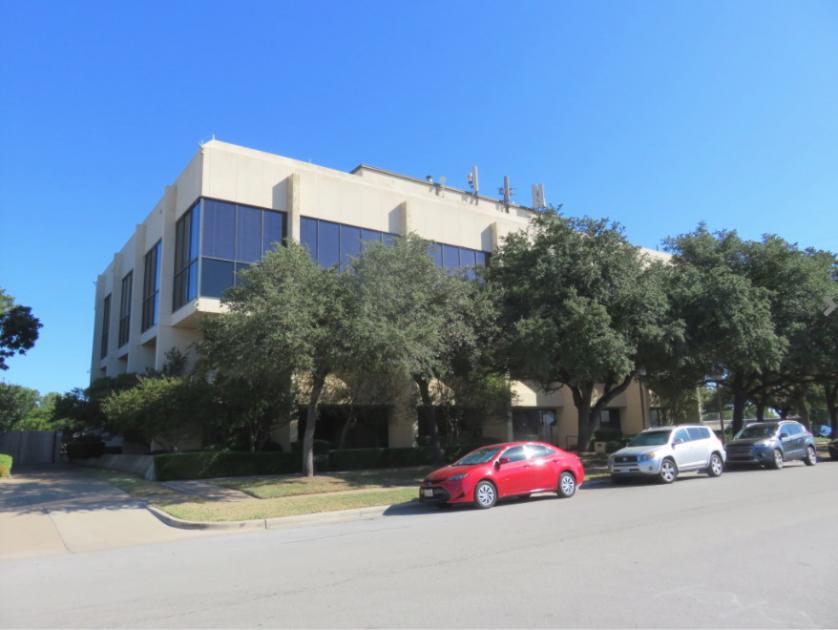
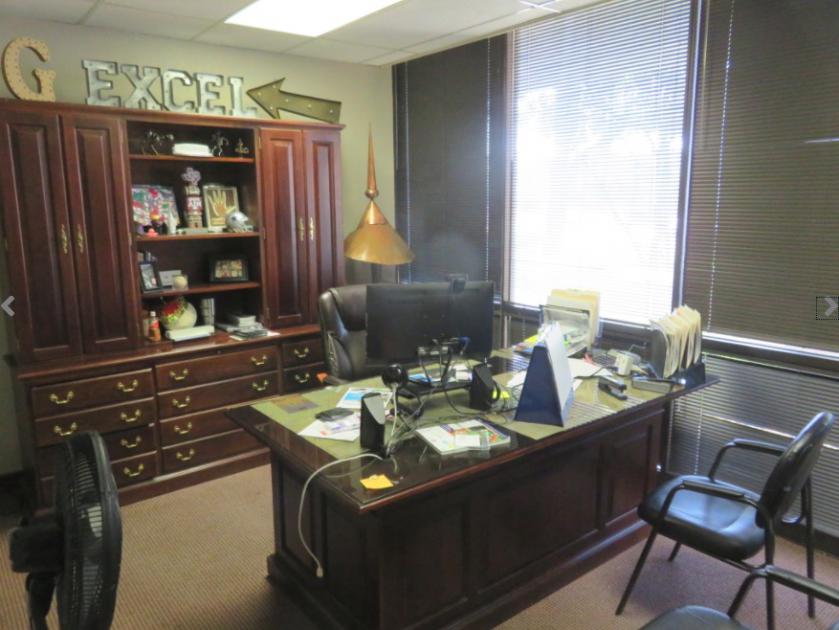
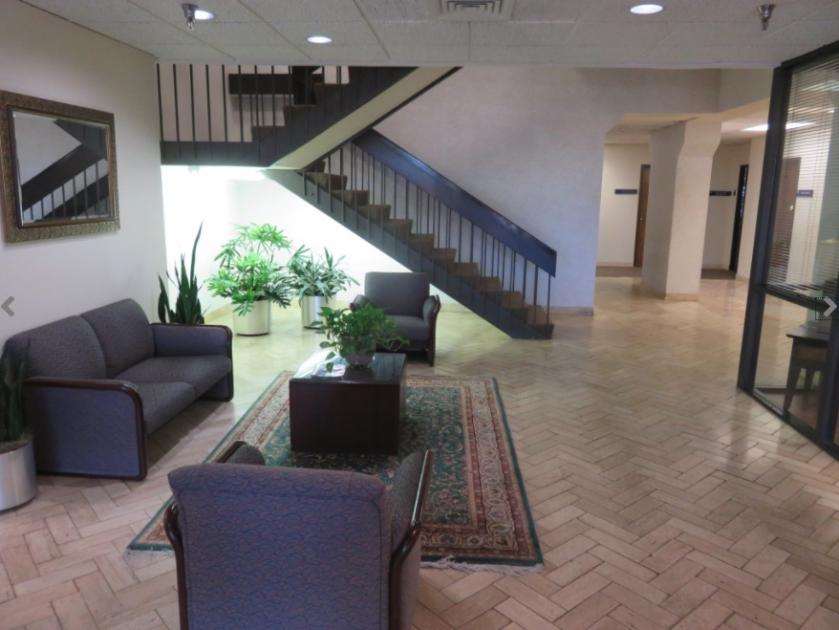
Office Space
5608 Malvey Ave Fort Worth, TX 76107
5608 Malvey Ave Fort Worth, TX 76107
Details & Description
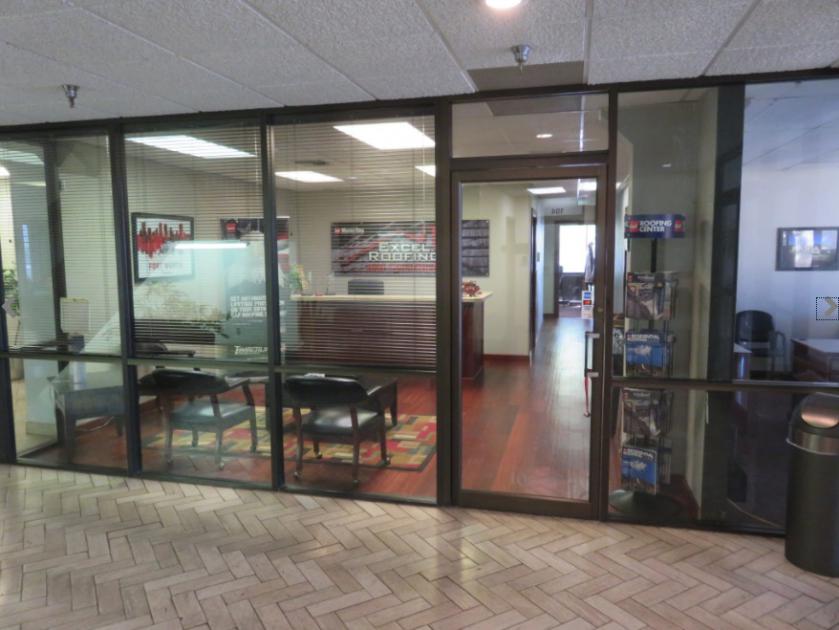
Additional Photos

Listing Agents

Nathan Vasseur
O: 817-335-7575
M: 682-429-7400
nvasseur@vasseurcre.com
O: 817-335-7575
M: 682-429-7400
nvasseur@vasseurcre.com
While we strive to provide the most accurate information, all listing information, and demographic data, is provided by third-parties. As such, MyEListing will not be responsible for the accuracy of the information. It is strongly recommended that you verify all information with the listing agent, and any relevant agencies, prior to making any decisions.