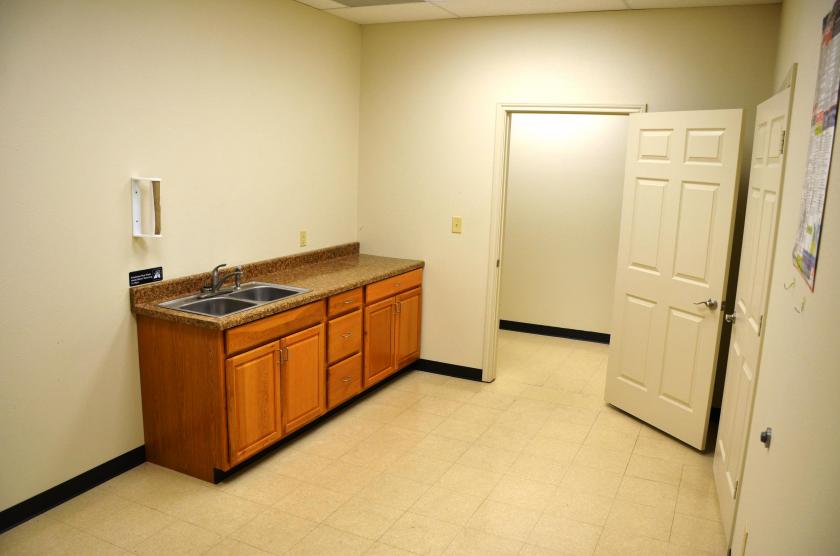
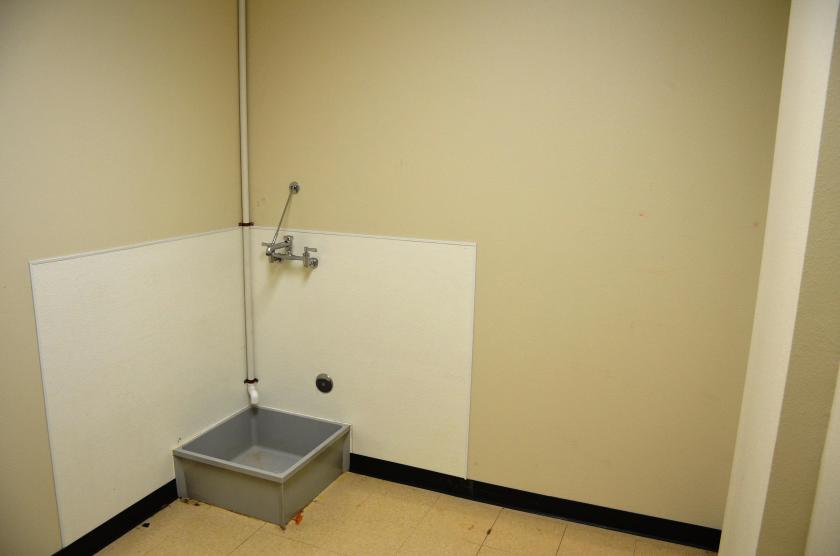
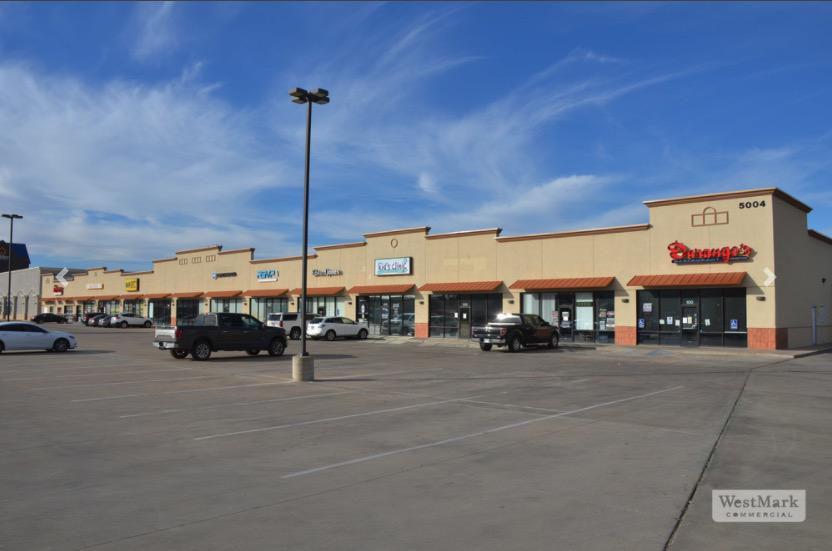
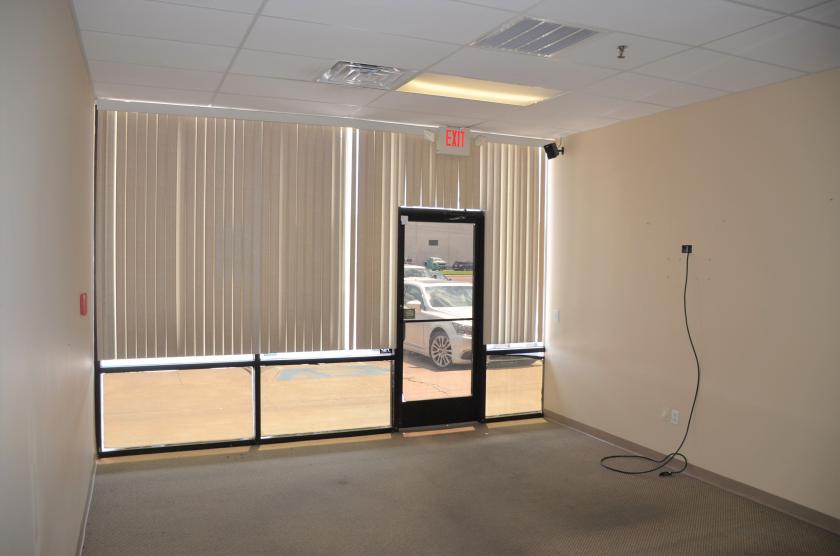
Retail Space
5004 Frankford Ave Lubbock, TX 79424
5004 Frankford Ave Lubbock, TX 79424
Details & Description
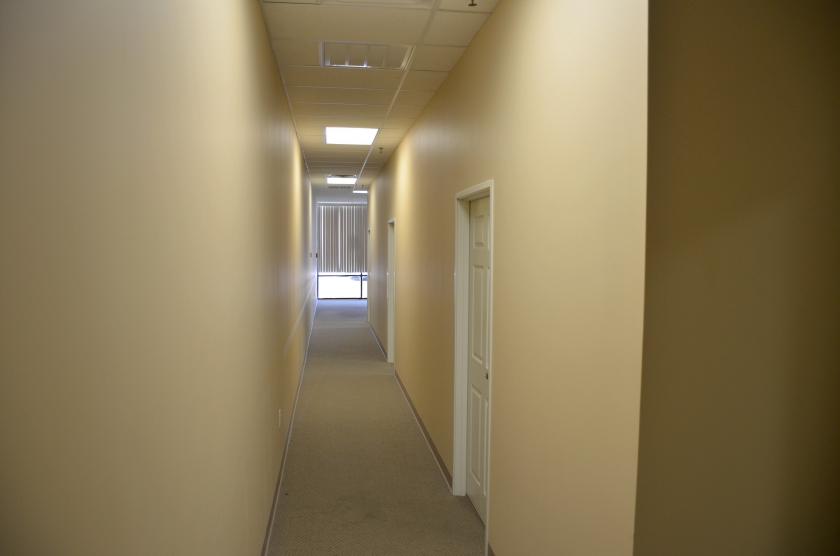
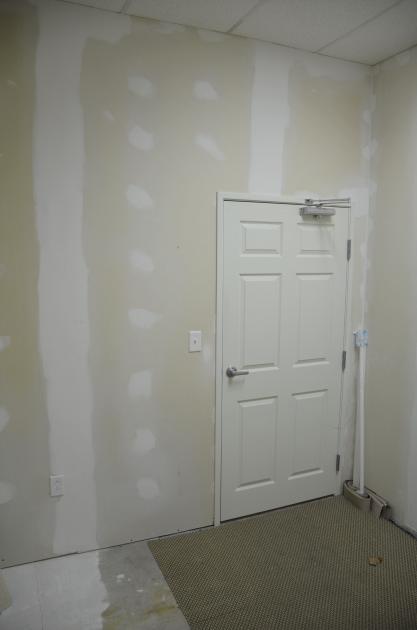
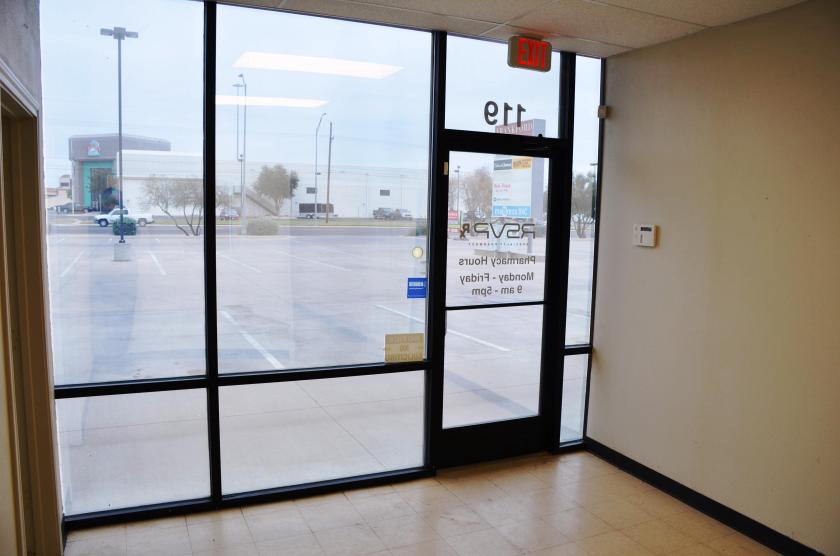
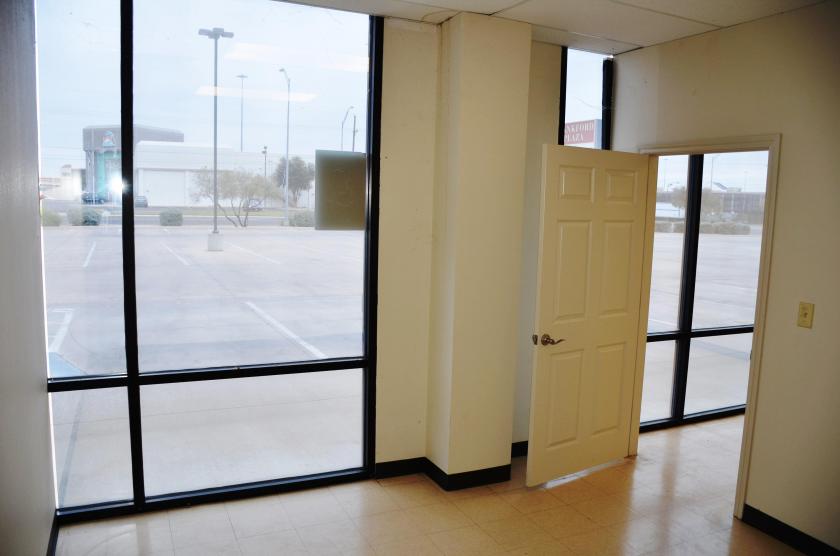
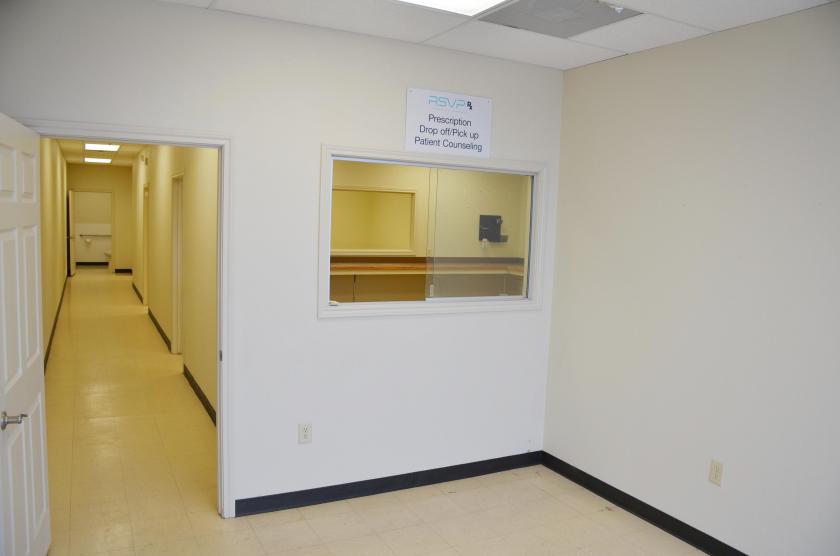
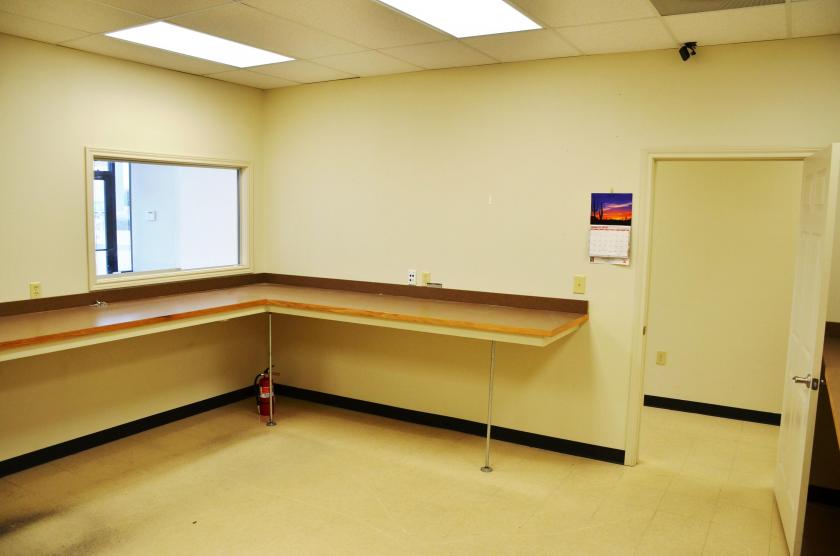
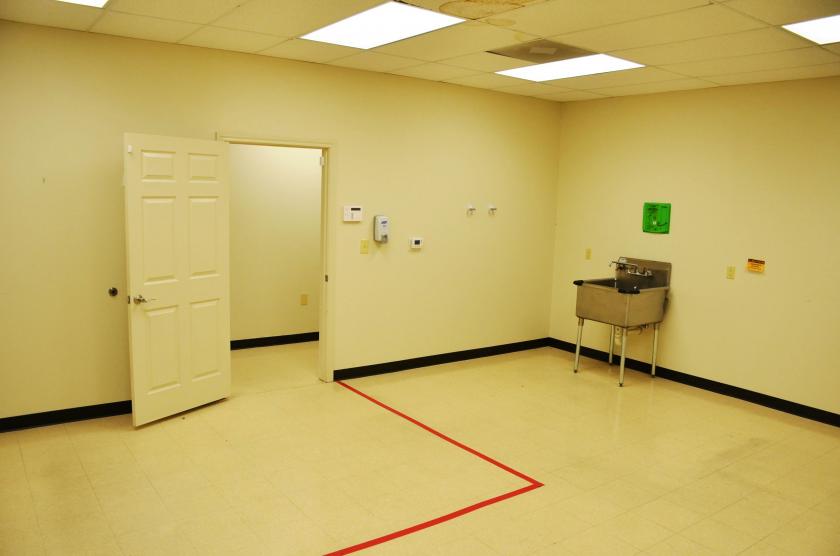
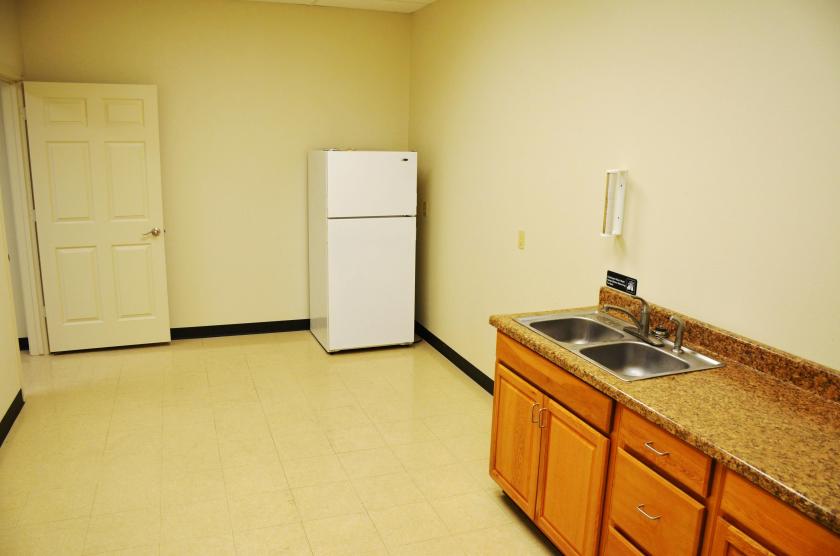
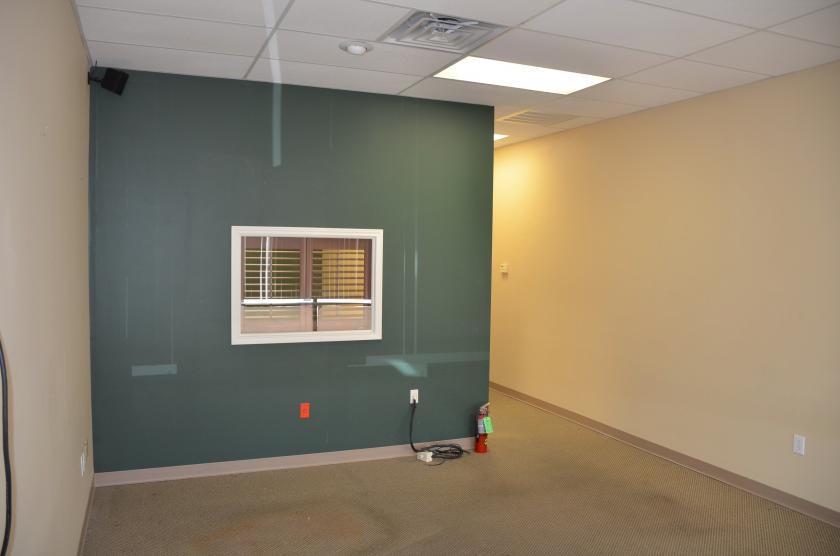
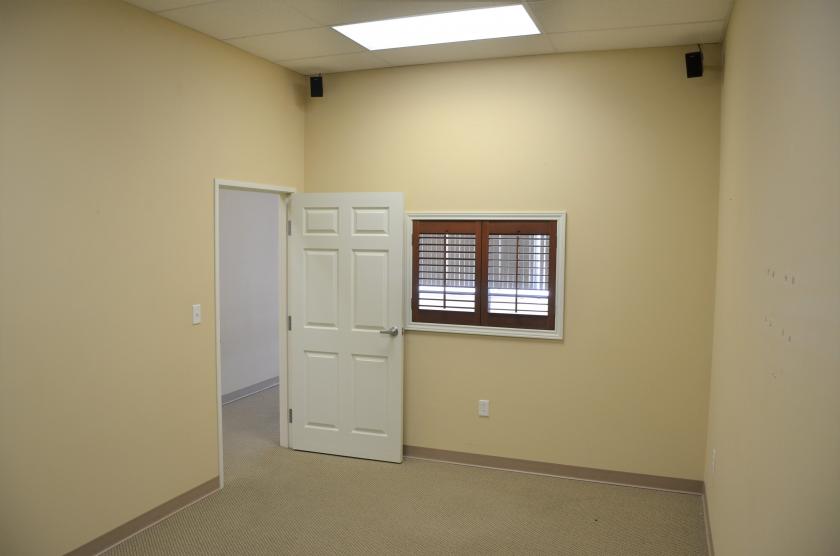
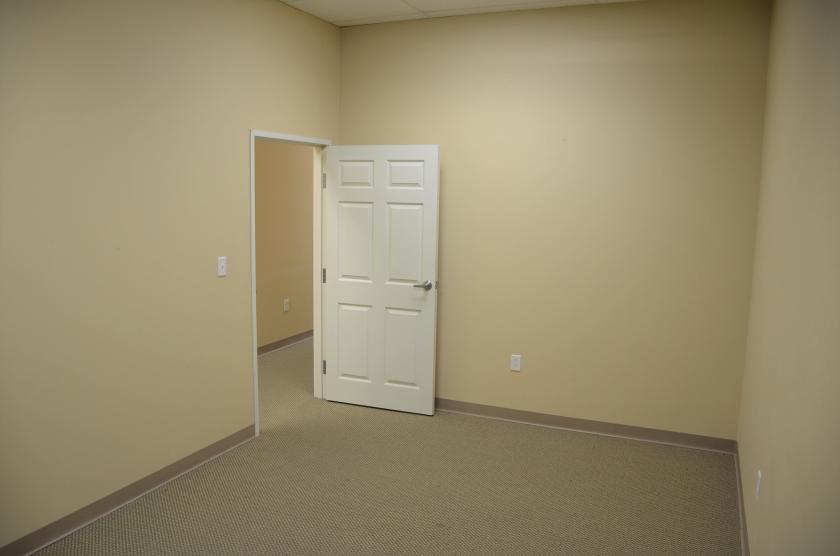
Additional Photos
Listing Agents

Kirk Schneider
O: 806-794-3300
M: 806-787-7773
kschneider@westmarkcommercial.com
O: 806-794-3300
M: 806-787-7773
kschneider@westmarkcommercial.com
While we strive to provide the most accurate information, all listing information, and demographic data, is provided by third-parties. As such, MyEListing will not be responsible for the accuracy of the information. It is strongly recommended that you verify all information with the listing agent, and any relevant agencies, prior to making any decisions.