Retail Space
2305B El Camino Real Palo Alto, CA 94306
2305B El Camino Real Palo Alto, CA 94306

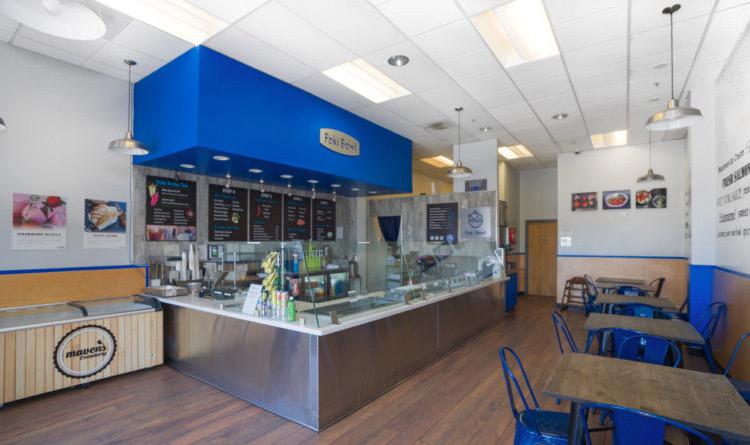
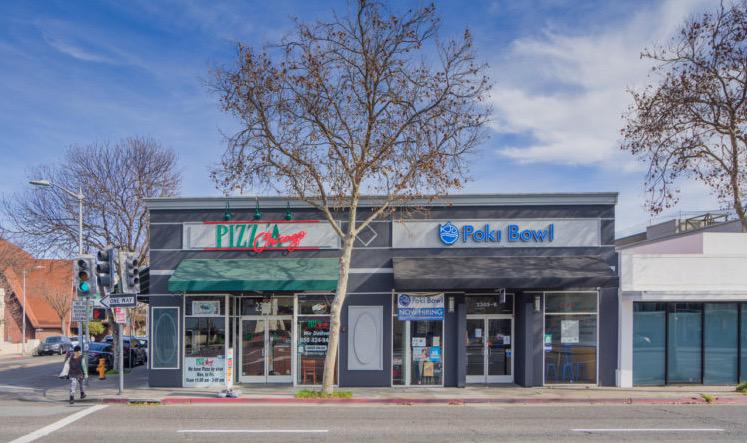
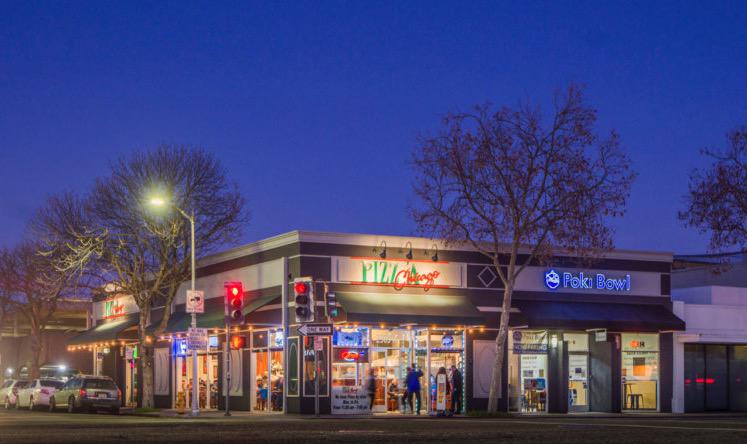
Details & Description
Additional Photos
Listing Agents

Brad Ehikian
M: 650-618-3001
brad.ehikian@prprop.com
M: 650-618-3001
brad.ehikian@prprop.com
While we strive to provide the most accurate information, all listing information, and demographic data, is provided by third-parties. As such, MyEListing will not be responsible for the accuracy of the information. It is strongly recommended that you verify all information with the listing agent, and any relevant agencies, prior to making any decisions.


