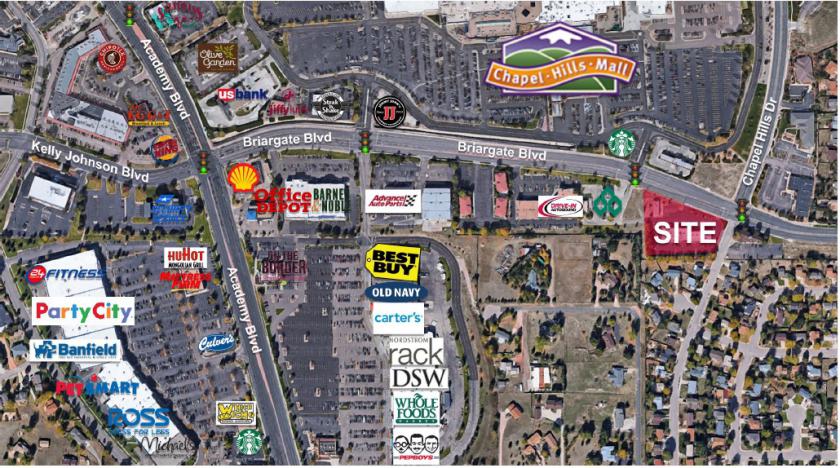
1-Mile | 3-Miles | 5-Miles | ||
---|---|---|---|---|
Total Population | 7,738 | 78,421 | 185,384 | |
Population Median Age | 37 | 37 | 37 | |
Population by Age | 0-9 Yrs | 928 (11%) | 9735 (12%) | 22606 (12%) |
10-19 Yrs | 1048 (13%) | 11030 (14%) | 26607 (14%) | |
20-29 Yrs | 1428 (18%) | 11870 (15%) | 29386 (15%) | |
30-39 Yrs | 1045 (13%) | 10366 (13%) | 24935 (13%) | |
40-49 Yrs | 822 (10%) | 9428 (12%) | 22682 (12%) | |
50-59 Yrs | 937 (12%) | 11188 (14%) | 25225 (13%) | |
60-69 Yrs | 949 (12%) | 8609 (10%) | 19361 (10%) | |
70+ Yrs | 582 (7%) | 6196 (7%) | 14581 (7%) | |
Median HH Income | $76,658 | $79,811 | $74,841 | |
Total Household Income | < 24K | 379 (12%) | 3300 (11%) | 8993 (12%) |
25-49K | 436 (14%) | 5156 (17%) | 13190 (18%) | |
50-74K | 647 (21%) | 5363 (18%) | 12755 (18%) | |
75-99K | 751 (24%) | 4782 (16%) | 10435 (14%) | |
100-199K | 624 (20%) | 8613 (29%) | 19365 (27%) | |
200K+ | 187 (6%) | 2265 (7%) | 4986 (7%) | |
Highest Education Level | No Diploma | 120 | 1596 | 4658 |
Diploma or GED | 804 | 8053 | 20769 | |
Some College | 1474 | 11107 | 27177 | |
Assoc. Degree | 619 | 5884 | 13018 | |
Bachelors Degree | 1385 | 14786 | 32830 | |
Higher Degree | 905 | 10509 | 22933 | |
Total Housing Units | 3,102 | 30,742 | 72,793 | |
--Owner-Occupied | 1,679 | 19,695 | 44,921 | |
--Renter-Occupied | 1,346 | 9,786 | 24,804 | |
Owner-Occupied Values | < 100K | 18 | 644 | 2048 |
100-199K | 206 | 3125 | 7687 | |
200-299K | 746 | 7278 | 15743 | |
300-399K | 444 | 5079 | 10277 | |
400-499K | 212 | 2133 | 5206 | |
500K+ | 51 | 1436 | 3961 | |
Total Working Age Population | 6,243 | 62,473 | 147,283 | |
In Work Force | 4,257 | 41,985 | 100,065 | |
Not In Work Force | 1,986 | 20,488 | 47,218 | |
Workforce Employed | 3,960 | 38,868 | 91,504 | |
Workforce Unemployed | 240 | 2,087 | 5,433 | |
Civlian Workforce | 4,200 | 40,955 | 96,937 | |
Military Workforce | 57 | 1,030 | 3,129 | |
Total Households | 3,024 | 29,480 | 69,725 | |
Family Households | 1,826 | 20,341 | 47,174 | |
Non-Family Households | 1,198 | 9,139 | 22,551 | |
Married Couple | 1,412 | 16,412 | 37,568 | |
Other Family | 415 | 3,930 | 9,606 | |
Married w/Child | 457 | 6,463 | 15,240 | |
Single Male w/Child | 152 | 722 | 1,532 | |
Single Female w/Child | 113 | 1,458 | 4,079 |
Population Change Last Two Decades - Plus Projection
2000 | % | 2010 | % | 2020 | % | 2030 | |
---|---|---|---|---|---|---|---|
Colorado | 4,301,261 | +17 | 5,029,196 | +16 | 5,838,181 | +15 | 6,733,658 |
El Paso County | 516,929 | +20 | 622,263 | +18 | 735,176 | +16 | 855,206 |
Total Working Age Population:
Total Households:
Total Working Age Population:
Total Households:
Total Working Age Population:
Total Households: