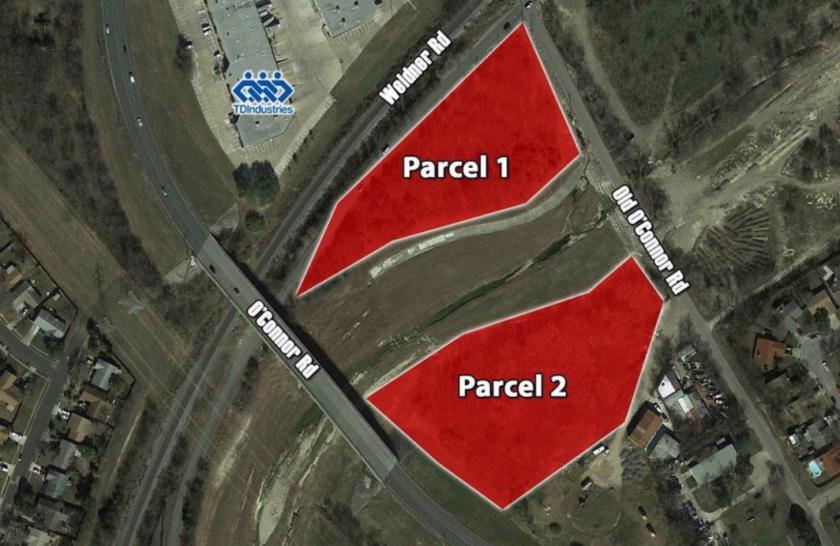
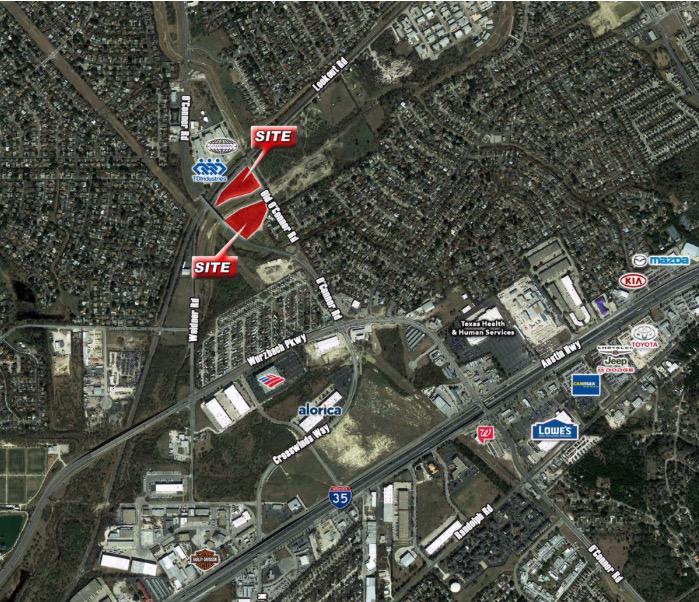
1-Mile | 3-Miles | 5-Miles | ||
---|---|---|---|---|
Total Population | 12,311 | 107,562 | 260,256 | |
Population Median Age | 39 | 37 | 37 | |
Population by Age | 0-9 Yrs | 1389 (11%) | 14568 (13%) | 36838 (14%) |
10-19 Yrs | 1954 (15%) | 14092 (13%) | 34211 (13%) | |
20-29 Yrs | 1573 (12%) | 15329 (14%) | 37710 (14%) | |
30-39 Yrs | 1464 (11%) | 15984 (14%) | 38640 (14%) | |
40-49 Yrs | 1776 (14%) | 14029 (13%) | 33765 (12%) | |
50-59 Yrs | 1504 (12%) | 12968 (12%) | 31531 (12%) | |
60-69 Yrs | 1327 (10%) | 11255 (10%) | 25859 (9%) | |
70+ Yrs | 1324 (10%) | 9337 (8%) | 21702 (8%) | |
Median HH Income | $58,187 | $59,366 | $59,981 | |
Total Household Income | < 24K | 774 (18%) | 6316 (17%) | 15302 (17%) |
25-49K | 933 (22%) | 8589 (23%) | 20995 (23%) | |
50-74K | 1050 (24%) | 8425 (22%) | 19094 (21%) | |
75-99K | 500 (11%) | 5412 (14%) | 12951 (14%) | |
100-199K | 924 (21%) | 7100 (19%) | 18608 (20%) | |
200K+ | 43 (1%) | 1076 (2%) | 3034 (3%) | |
Highest Education Level | No Diploma | 759 | 6702 | 16828 |
Diploma or GED | 2681 | 21077 | 45757 | |
Some College | 2506 | 19460 | 44941 | |
Assoc. Degree | 918 | 7856 | 17836 | |
Bachelors Degree | 1030 | 10794 | 30273 | |
Higher Degree | 392 | 5454 | 15913 | |
Total Housing Units | 4,430 | 39,479 | 96,725 | |
--Owner-Occupied | 2,666 | 23,075 | 54,887 | |
--Renter-Occupied | 1,558 | 13,843 | 35,098 | |
Owner-Occupied Values | < 100K | 583 | 3793 | 9891 |
100-199K | 1924 | 15987 | 32753 | |
200-299K | 129 | 2609 | 9397 | |
300-399K | 8 | 399 | 1775 | |
400-499K | 0 | 39 | 596 | |
500K+ | 22 | 247 | 474 | |
Total Working Age Population | 9,699 | 84,444 | 202,716 | |
In Work Force | 6,024 | 55,722 | 134,337 | |
Not In Work Force | 3,675 | 28,722 | 68,379 | |
Workforce Employed | 5,711 | 52,660 | 126,967 | |
Workforce Unemployed | 256 | 2,599 | 5,894 | |
Civlian Workforce | 5,968 | 55,259 | 132,862 | |
Military Workforce | 56 | 463 | 1,475 | |
Total Households | 4,225 | 36,918 | 89,985 | |
Family Households | 2,864 | 24,135 | 59,555 | |
Non-Family Households | 1,360 | 12,783 | 30,429 | |
Married Couple | 2,096 | 16,956 | 41,824 | |
Other Family | 768 | 7,179 | 17,731 | |
Married w/Child | 732 | 6,836 | 17,383 | |
Single Male w/Child | 46 | 1,123 | 2,649 | |
Single Female w/Child | 421 | 2,889 | 7,486 |
Population Change Last Two Decades - Plus Projection
2000 | % | 2010 | % | 2020 | % | 2030 | |
---|---|---|---|---|---|---|---|
Texas | 20,851,820 | +21 | 25,145,561 | +18 | 29,677,668 | +18 | 34,894,452 |
Guadalupe County | 89,023 | +48 | 131,533 | +29 | 170,266 | +30 | 221,353 |
Bexar County | 1,392,931 | +23 | 1,714,773 | +22 | 2,093,502 | +20 | 2,502,617 |
Comal County | 78,021 | +39 | 108,472 | +36 | 147,330 | +39 | 204,873 |
Total Working Age Population:
Total Households:
Total Working Age Population:
Total Households:
Total Working Age Population:
Total Households: