Office Space
120 18th St S Birmingham, AL 35233
120 18th St S Birmingham, AL 35233
Details & Description
Property Highlights
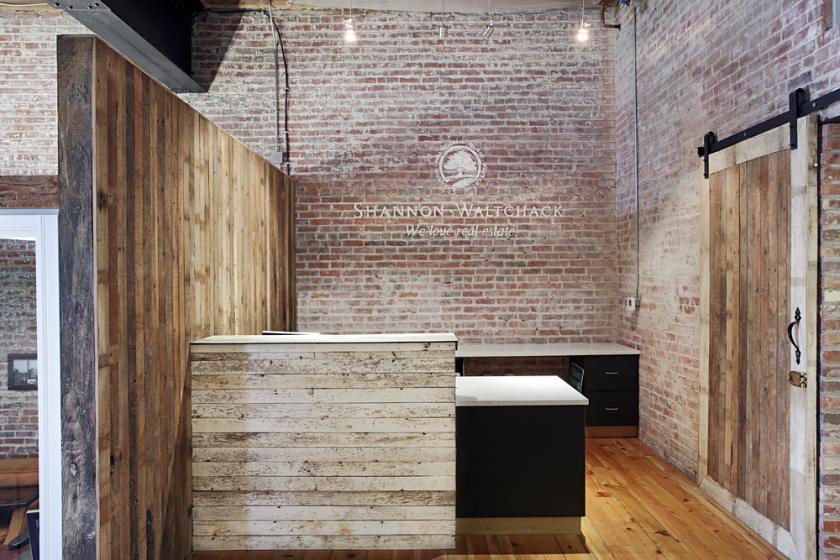
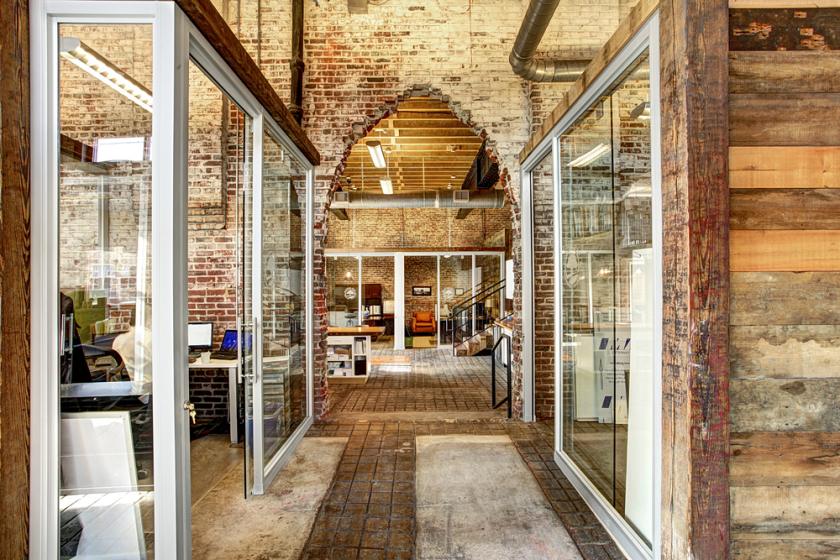
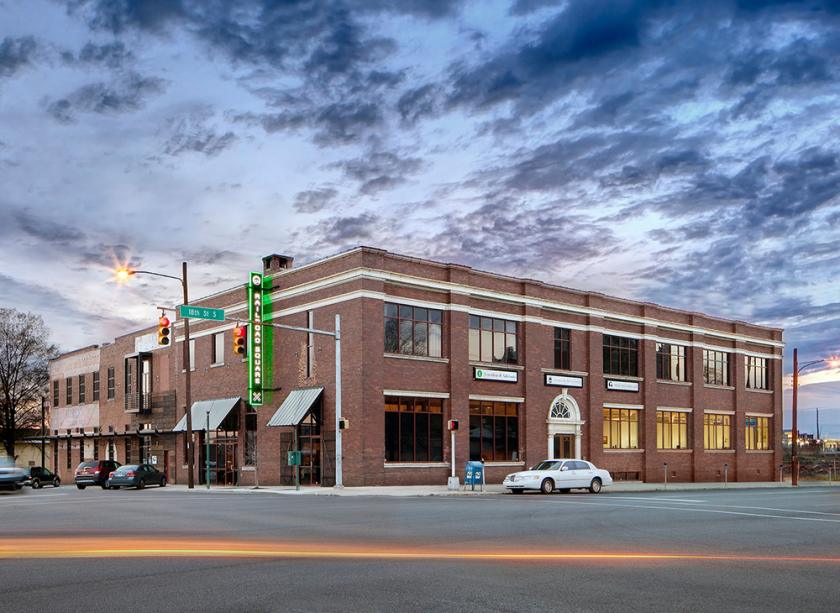
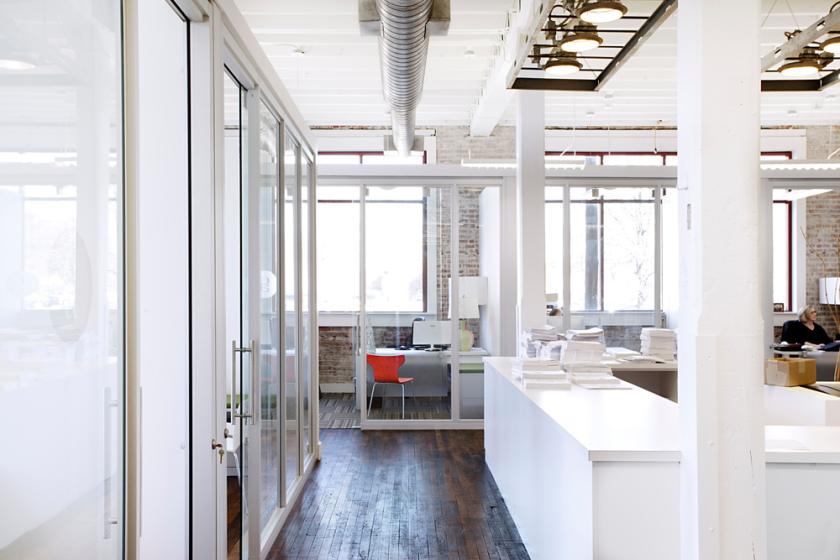
• Most unique historic office building in Birmingham - featured in The New York Times
• Located in the heart of Parkside District, on the edge of Railroad Park
Additional Photos


Listing Agents

Len Shannon
O: 205-222-1664
ls@shanwalt.com
O: 205-222-1664
ls@shanwalt.com
While we strive to provide the most accurate information, all listing information, and demographic data, is provided by third-parties. As such, MyEListing will not be responsible for the accuracy of the information. It is strongly recommended that you verify all information with the listing agent, and any relevant agencies, prior to making any decisions.