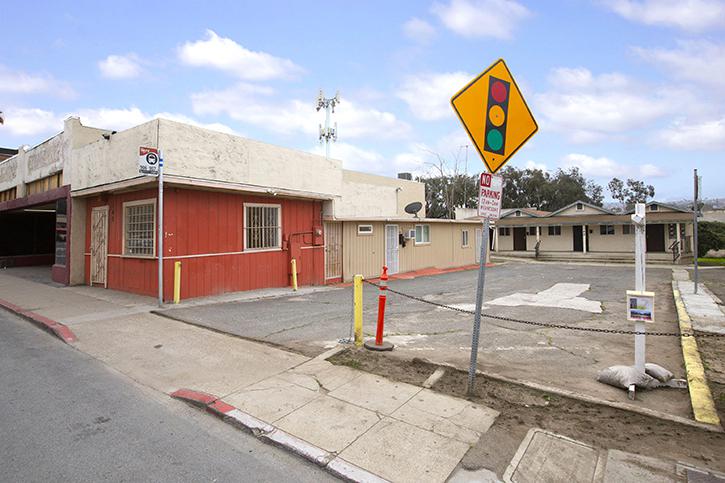
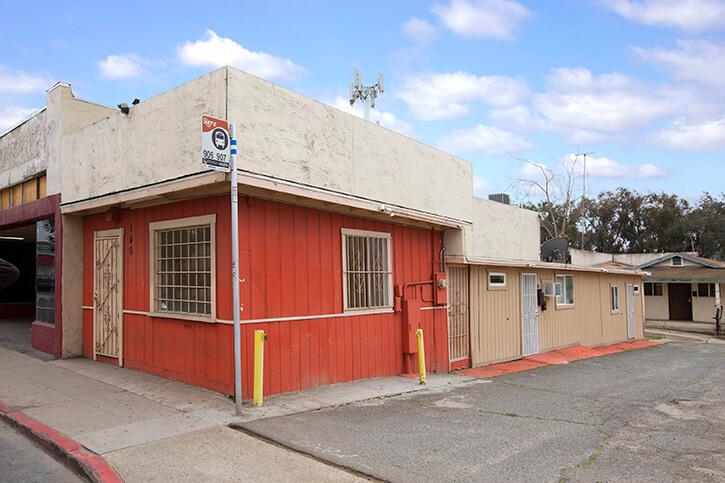
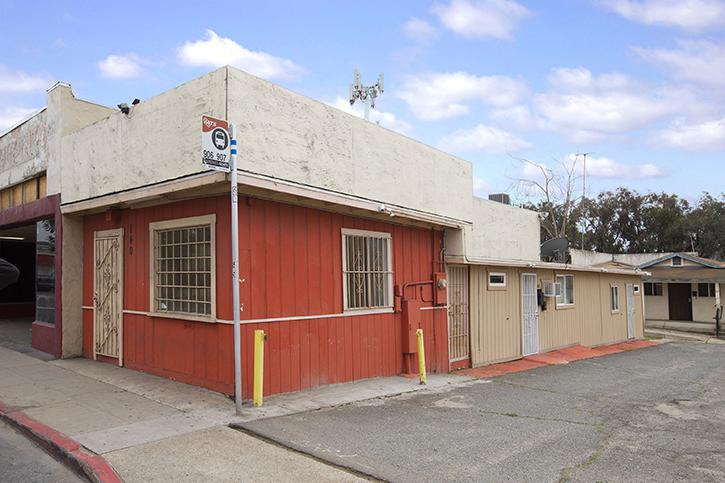
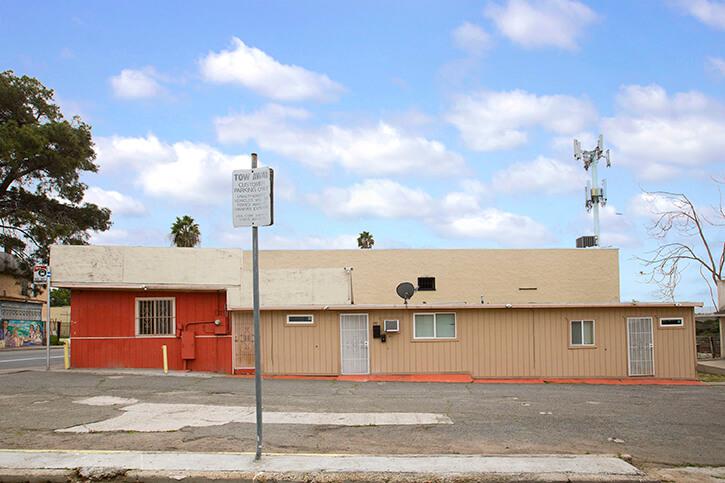
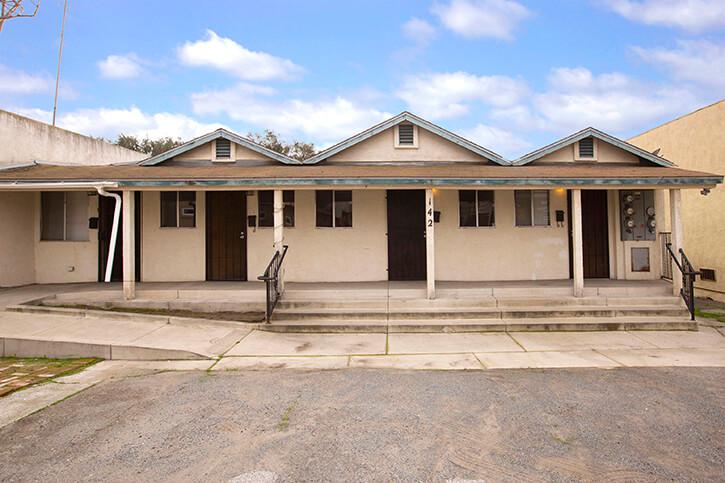
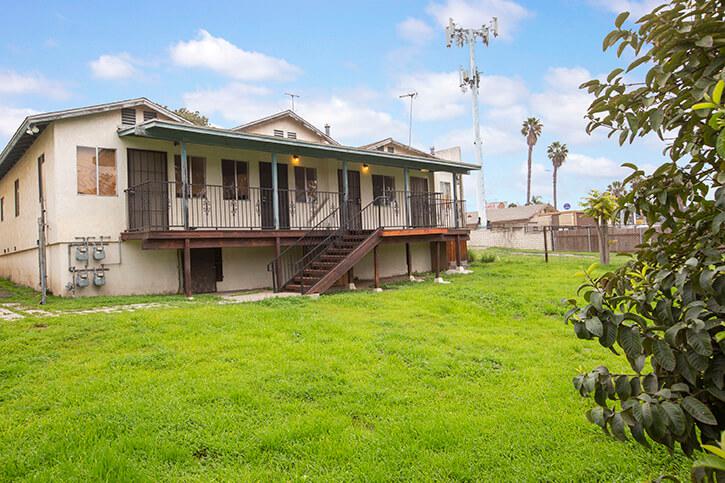
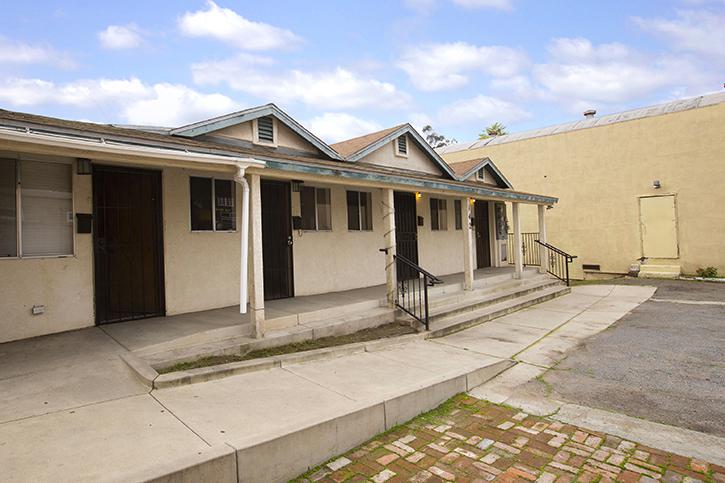
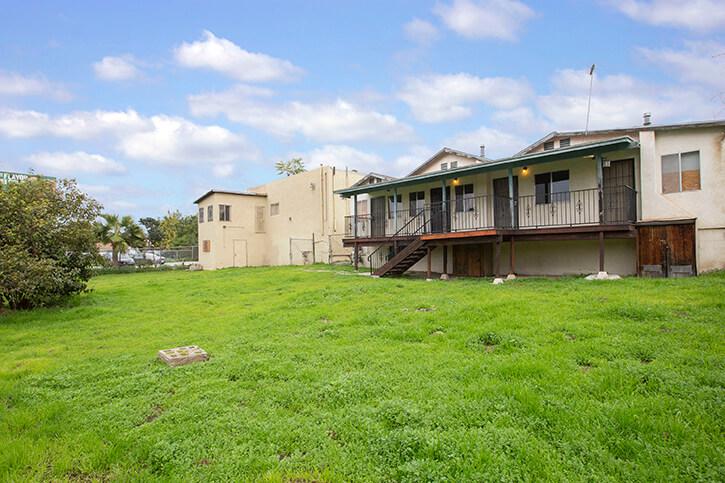
Attention Developers and Investors! Property offers a superb commercial business opportunity in the heart of the San Ysidro California business district, with strong vehicle and foot traffic, minutes from the Mexican border. Investors can acquire an asset in the South Bay region of San Diego County. The San Ysidro Port of Entry is the fourth-busiest land border crossing in the world and only 20 minutes from the San Diego International Airport. The location benefits not only from the San Ysidro area but also from the very mobile population of Tijuana, Mexico. The property is zoned commercial with a multifamily dwelling use code. Lot Size 9301 Square Feet/.213 acres. Lot dimensions 50 x 184 x 51 x 188. Front building at 140 W. San Ysidro Blvd consists of a store front office and 3 storage units. Rear building at 142 W. San Ysidro Blvd consists of 4 apartment units. The possibilities for the commercial development of this property are many.Buyer to very all information including measurements, permits, zoning, use codes and condition before COE. Buildings and units are vacant. Property sold "as is", seller will make no repairs. Do not go onto property. Property will be shown only with an accepted offer. Adjacent property at 144-146 W. San Ysidro Blvd. is owned by the same seller is also for sale. Your buyer can own two adjacent properties/parcels.