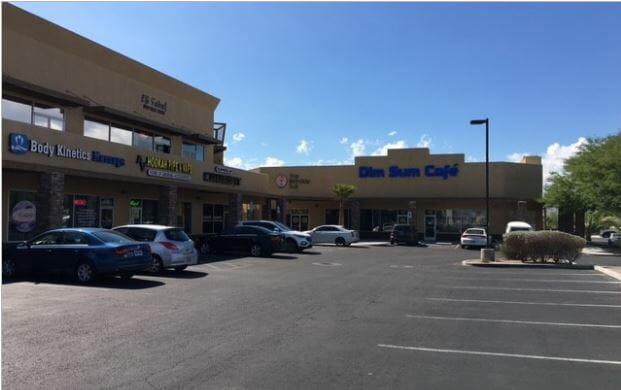
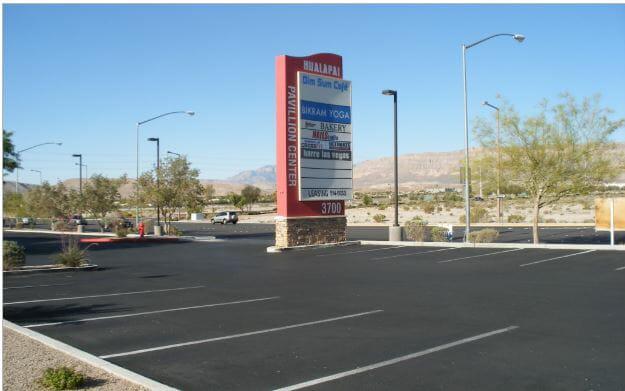
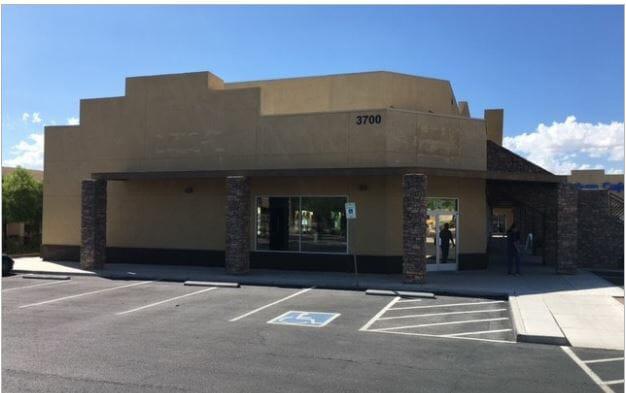
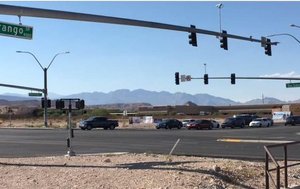
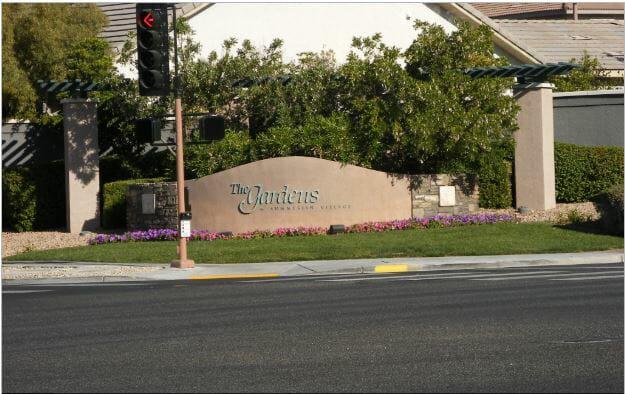
1-Mile | 3-Miles | 5-Miles | ||
---|---|---|---|---|
Total Population | 18,027 | 128,604 | 279,608 | |
Population Median Age | 43 | 41 | 40 | |
Population by Age | 0-9 Yrs | 1783 (9%) | 13419 (10%) | 30387 (10%) |
10-19 Yrs | 1948 (10%) | 13921 (10%) | 31998 (11%) | |
20-29 Yrs | 1767 (9%) | 15916 (12%) | 35788 (12%) | |
30-39 Yrs | 2293 (12%) | 18301 (14%) | 40340 (14%) | |
40-49 Yrs | 2729 (15%) | 18709 (14%) | 41373 (14%) | |
50-59 Yrs | 2401 (13%) | 18094 (14%) | 39581 (14%) | |
60-69 Yrs | 2469 (13%) | 15653 (12%) | 31855 (11%) | |
70+ Yrs | 2637 (14%) | 14591 (11%) | 28287 (10%) | |
Median HH Income | $73,435 | $66,267 | $65,036 | |
Total Household Income | < 24K | 763 (10%) | 7103 (13%) | 15288 (14%) |
25-49K | 1526 (21%) | 11715 (22%) | 25286 (23%) | |
50-74K | 1318 (18%) | 10091 (19%) | 20954 (19%) | |
75-99K | 1176 (16%) | 7576 (14%) | 15582 (14%) | |
100-199K | 1713 (24%) | 10233 (19%) | 21854 (20%) | |
200K+ | 559 (7%) | 4512 (8%) | 8351 (7%) | |
Highest Education Level | No Diploma | 1119 | 8199 | 18608 |
Diploma or GED | 3632 | 23261 | 52190 | |
Some College | 3563 | 24181 | 52339 | |
Assoc. Degree | 1040 | 7863 | 16827 | |
Bachelors Degree | 2803 | 20421 | 40973 | |
Higher Degree | 1532 | 11130 | 21776 | |
Total Housing Units | 7,967 | 59,316 | 124,030 | |
--Owner-Occupied | 4,164 | 26,650 | 57,701 | |
--Renter-Occupied | 2,891 | 24,579 | 49,614 | |
Owner-Occupied Values | < 100K | 82 | 1120 | 3279 |
100-199K | 302 | 3050 | 11099 | |
200-299K | 1621 | 8555 | 17606 | |
300-399K | 1069 | 6668 | 11724 | |
400-499K | 596 | 3142 | 5121 | |
500K+ | 494 | 4115 | 8872 | |
Total Working Age Population | 15,106 | 106,260 | 228,943 | |
In Work Force | 9,415 | 69,543 | 152,069 | |
Not In Work Force | 5,691 | 36,717 | 76,874 | |
Workforce Employed | 8,903 | 65,507 | 143,119 | |
Workforce Unemployed | 494 | 3,960 | 8,735 | |
Civlian Workforce | 9,397 | 69,467 | 151,855 | |
Military Workforce | 18 | 76 | 214 | |
Total Households | 7,055 | 51,230 | 107,315 | |
Family Households | 4,839 | 31,488 | 66,893 | |
Non-Family Households | 2,216 | 19,741 | 40,422 | |
Married Couple | 3,499 | 22,073 | 46,148 | |
Other Family | 1,340 | 9,416 | 20,745 | |
Married w/Child | 966 | 7,693 | 17,179 | |
Single Male w/Child | 237 | 1,494 | 3,142 | |
Single Female w/Child | 450 | 2,852 | 6,421 |
Population Change Last Two Decades - Plus Projection
2000 | % | 2010 | % | 2020 | % | 2030 | |
---|---|---|---|---|---|---|---|
Nevada | 1,998,257 | +35 | 2,700,551 | +17 | 3,149,234 | +10 | 3,460,728 |
Clark County | 1,375,765 | +42 | 1,951,269 | +19 | 2,318,174 | +10 | 2,550,048 |
Total Working Age Population:
Total Households:
Total Working Age Population:
Total Households:
Total Working Age Population:
Total Households: