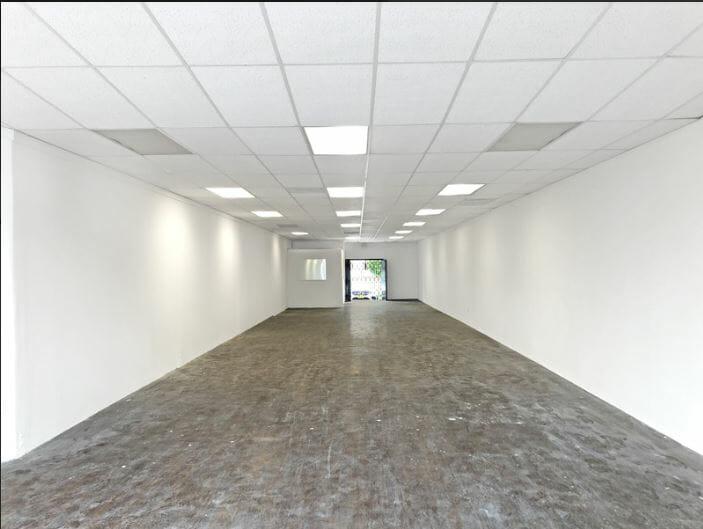
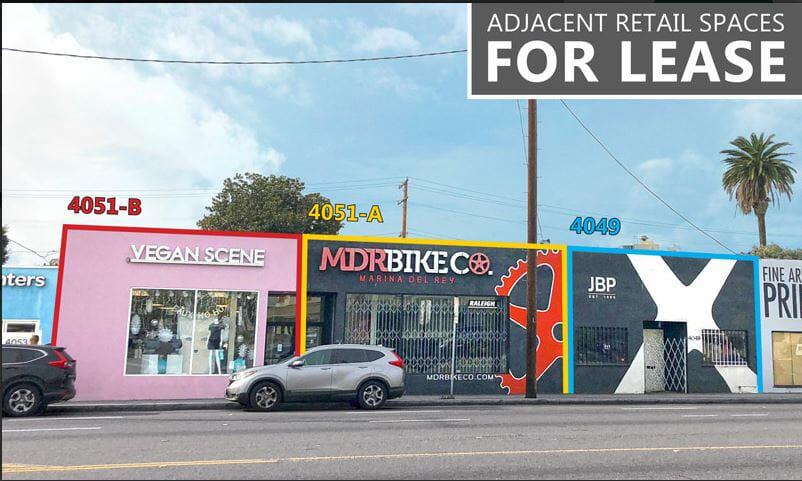
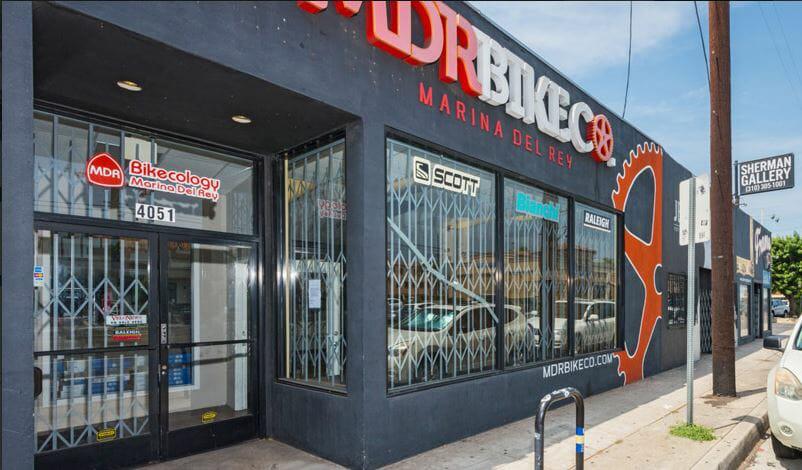
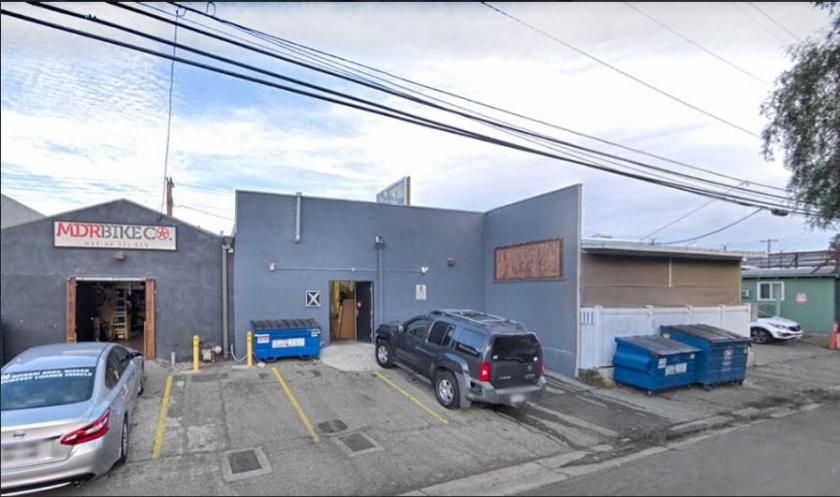
1-Mile | 3-Miles | 5-Miles | ||
---|---|---|---|---|
Total Population | 33,554 | 228,987 | 503,004 | |
Population Median Age | 40 | 39 | 39 | |
Population by Age | 0-9 Yrs | 3061 (9%) | 20992 (9%) | 46642 (9%) |
10-19 Yrs | 1945 (5%) | 19139 (8%) | 39191 (7%) | |
20-29 Yrs | 5132 (15%) | 38116 (16%) | 90750 (18%) | |
30-39 Yrs | 7525 (22%) | 44519 (19%) | 96021 (19%) | |
40-49 Yrs | 5274 (15%) | 33127 (14%) | 70637 (14%) | |
50-59 Yrs | 4037 (12%) | 28505 (12%) | 60604 (12%) | |
60-69 Yrs | 3925 (11%) | 23854 (10%) | 50852 (10%) | |
70+ Yrs | 2657 (7%) | 20737 (9%) | 48307 (9%) | |
Median HH Income | $100,875 | $88,132 | $88,341 | |
Total Household Income | < 24K | 1886 (11%) | 15760 (15%) | 34904 (15%) |
25-49K | 2101 (12%) | 15651 (15%) | 33324 (14%) | |
50-74K | 2024 (12%) | 14113 (13%) | 31480 (13%) | |
75-99K | 2031 (12%) | 11774 (11%) | 27883 (12%) | |
100-199K | 4667 (28%) | 27416 (26%) | 62472 (27%) | |
200K+ | 3502 (21%) | 18705 (18%) | 39116 (17%) | |
Highest Education Level | No Diploma | 2039 | 14217 | 24803 |
Diploma or GED | 2455 | 16862 | 35821 | |
Some College | 4323 | 30451 | 64760 | |
Assoc. Degree | 1288 | 8948 | 20234 | |
Bachelors Degree | 9913 | 61267 | 137140 | |
Higher Degree | 6745 | 42329 | 100510 | |
Total Housing Units | 17,533 | 111,876 | 248,832 | |
--Owner-Occupied | 5,993 | 37,893 | 81,891 | |
--Renter-Occupied | 10,219 | 65,526 | 147,289 | |
Owner-Occupied Values | < 100K | 74 | 653 | 1308 |
100-199K | 69 | 272 | 651 | |
200-299K | 76 | 426 | 1303 | |
300-399K | 41 | 727 | 2544 | |
400-499K | 172 | 1541 | 3943 | |
500K+ | 5561 | 34273 | 72141 | |
Total Working Age Population | 29,379 | 197,706 | 433,084 | |
In Work Force | 22,166 | 141,738 | 310,850 | |
Not In Work Force | 7,212 | 55,968 | 122,234 | |
Workforce Employed | 21,127 | 133,868 | 292,846 | |
Workforce Unemployed | 1,040 | 7,855 | 17,875 | |
Civlian Workforce | 22,166 | 141,723 | 310,721 | |
Military Workforce | 0 | 15 | 129 | |
Total Households | 16,212 | 103,419 | 229,180 | |
Family Households | 7,010 | 47,980 | 104,357 | |
Non-Family Households | 9,202 | 55,439 | 124,823 | |
Married Couple | 5,209 | 35,890 | 77,612 | |
Other Family | 1,801 | 12,090 | 26,745 | |
Married w/Child | 1,740 | 13,336 | 30,127 | |
Single Male w/Child | 280 | 1,673 | 3,130 | |
Single Female w/Child | 563 | 3,604 | 8,001 |
Population Change Last Two Decades - Plus Projection
2000 | % | 2010 | % | 2020 | % | 2030 | |
---|---|---|---|---|---|---|---|
California | 33,871,648 | +10 | 37,253,956 | +9 | 40,467,295 | +8 | 43,631,295 |
Los Angeles County | 9,519,338 | +3 | 9,818,605 | +6 | 10,369,367 | +4 | 10,759,850 |
Total Working Age Population:
Total Households:
Total Working Age Population:
Total Households:
Total Working Age Population:
Total Households: