Specialty Real Estate
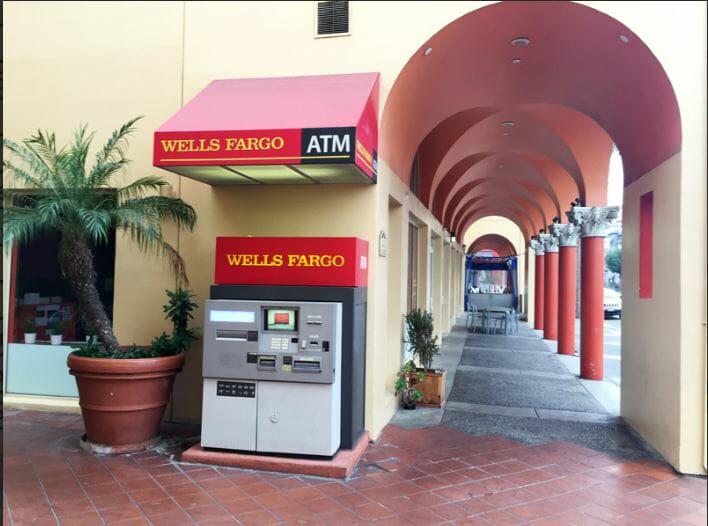
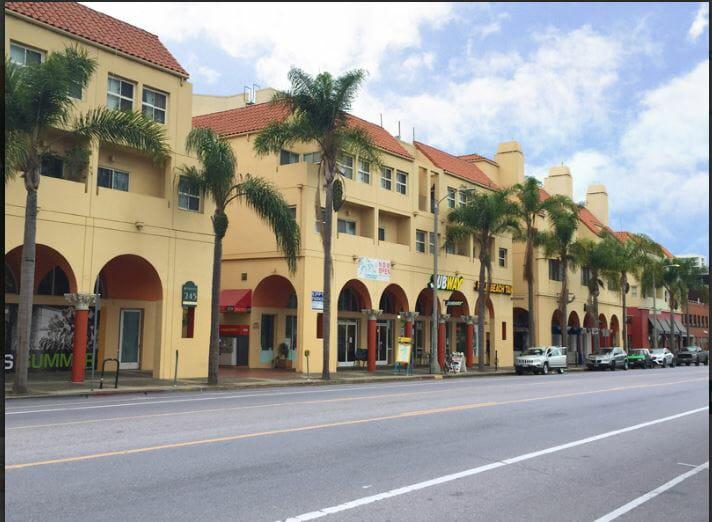
245 Main Street Los Angeles, CA 90291
245 Main Street Los Angeles, CA 90291
Details & Description
Listing Agents

Rafael Padilla
O: 310-395-2663
rafael@parcommercial.com
O: 310-395-2663
rafael@parcommercial.com
While we strive to provide the most accurate information, all listing information, and demographic data, is provided by third-parties. As such, MyEListing will not be responsible for the accuracy of the information. It is strongly recommended that you verify all information with the listing agent, and any relevant agencies, prior to making any decisions.