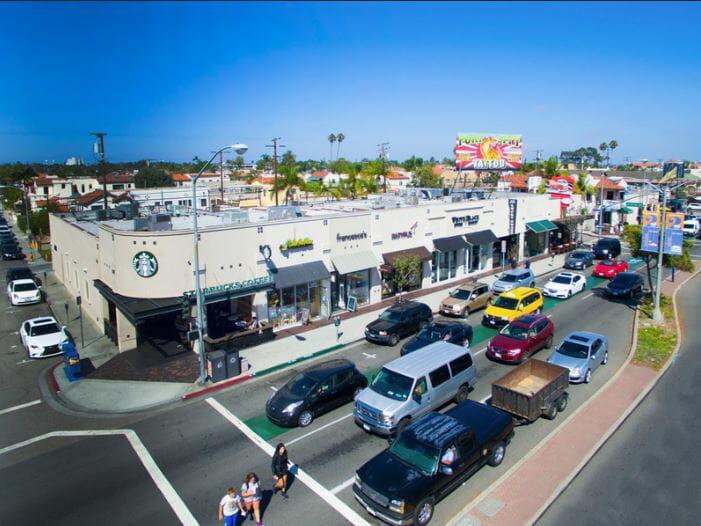
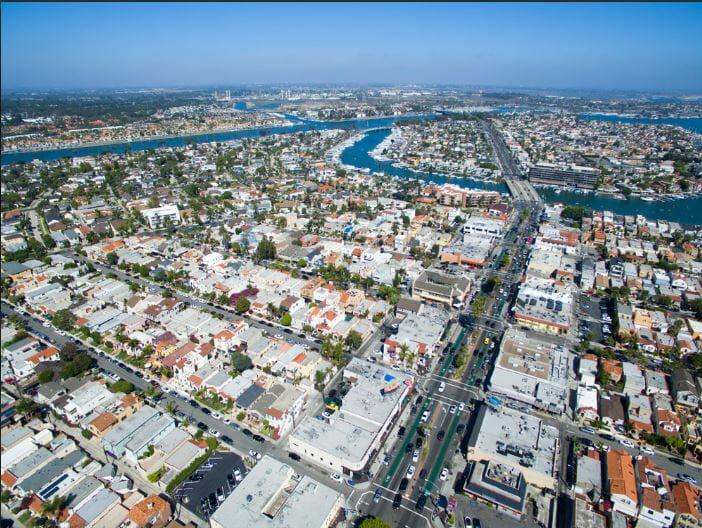
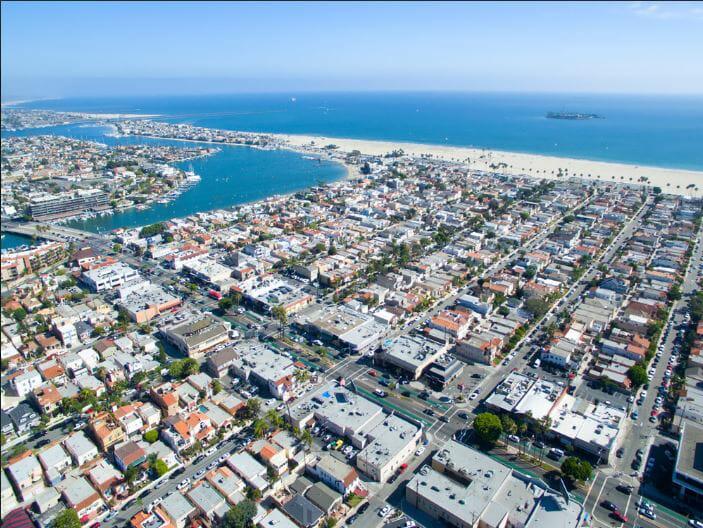
PROPERTY DESCRIPTIONLocated on the Signalized Corner of E. 2nd Street & La Verne AvenueOver 30 Feet of FrontageSIZE: Approximately 2,100 square feetRATE: $5.25 per square foot, per month, NNN (Estimated to be $1.70 per square foot)PARKING: Two (2) reserved parking spaces with additional parking available on the street and public parking lots in the area as wellAVAILABLE: June 2019EXPLORE THE SHORE, in the charming beachside community of Belmont Shore. This business corridor lies in the heart of this exclusive seaside community, affectionately referred to by locals as “The Shore.”Belmont Shore is hugged by water with the Pacific Ocean to the south, Alamitos Bay to the east, and Marine Stadium to the north. Kite surfers love the great ocean breezes found here. The calm water of the bay makes for family gatherings with swimming, kayaking, stand-up boarding, sailing and boating.2ND STREET and its 15 intersecting side streets make up the charming business district of Belmont Shore, home to more than 250 businesses. Strollers, bikes and dog walking are a familiar scene as people meet up with old friends and make new ones in this lively Beach Community.Belmont Shore Bicycle Sharrows with a “green lane.” The 0.6 mile lane runs along both sides of 2nd Street in Belmont Shore. Sharrows are chevrons combined with bicycle stencils placed in the center of a travel lane. They indicate that bicycles and motor vehicles share the lane.