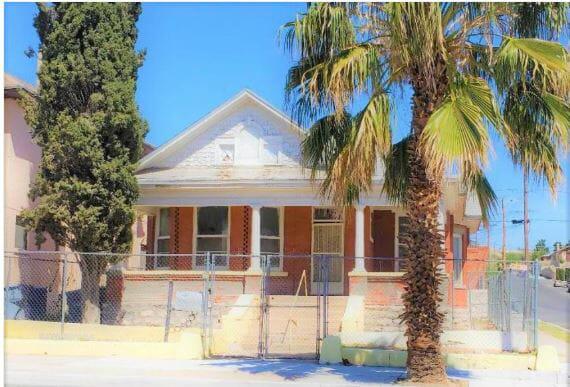
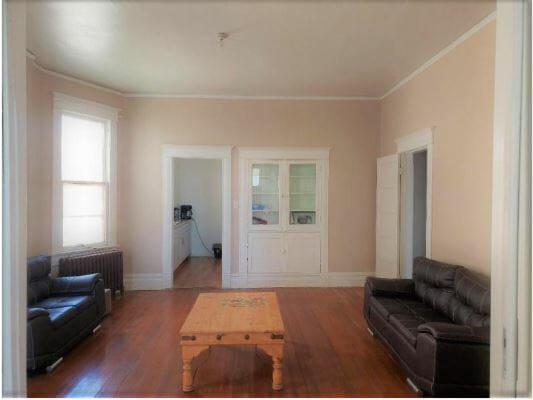
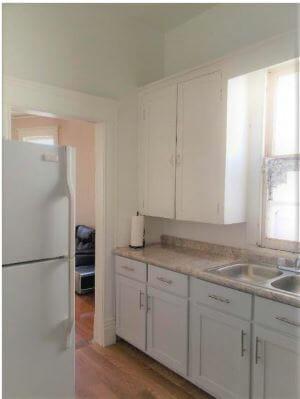
1-Mile | 3-Miles | 5-Miles | ||
---|---|---|---|---|
Total Population | 14,753 | 61,078 | 131,357 | |
Population Median Age | 42 | 40 | 38 | |
Population by Age | 0-9 Yrs | 1126 (7%) | 6777 (11%) | 16692 (12%) |
10-19 Yrs | 1535 (10%) | 7880 (12%) | 16991 (12%) | |
20-29 Yrs | 2383 (16%) | 9736 (15%) | 23235 (17%) | |
30-39 Yrs | 2111 (14%) | 7740 (12%) | 16465 (12%) | |
40-49 Yrs | 1839 (12%) | 6685 (10%) | 13379 (10%) | |
50-59 Yrs | 2167 (14%) | 7972 (13%) | 16125 (12%) | |
60-69 Yrs | 1715 (11%) | 6429 (10%) | 12669 (9%) | |
70+ Yrs | 1877 (12%) | 7860 (12%) | 15801 (12%) | |
Median HH Income | $22,431 | $26,328 | $31,126 | |
Total Household Income | < 24K | 3130 (54%) | 11146 (48%) | 20297 (42%) |
25-49K | 1338 (23%) | 5900 (25%) | 12896 (26%) | |
50-74K | 507 (8%) | 2472 (10%) | 6442 (13%) | |
75-99K | 266 (4%) | 1403 (6%) | 3237 (6%) | |
100-199K | 346 (6%) | 1692 (7%) | 3954 (8%) | |
200K+ | 151 (2%) | 484 (2%) | 953 (1%) | |
Highest Education Level | No Diploma | 3992 | 14724 | 26759 |
Diploma or GED | 2285 | 8073 | 18667 | |
Some College | 2217 | 8038 | 16691 | |
Assoc. Degree | 464 | 2451 | 5828 | |
Bachelors Degree | 1206 | 5070 | 11923 | |
Higher Degree | 758 | 3144 | 6068 | |
Total Housing Units | 6,891 | 27,424 | 55,540 | |
--Owner-Occupied | 1,514 | 8,680 | 19,309 | |
--Renter-Occupied | 4,223 | 14,416 | 28,471 | |
Owner-Occupied Values | < 100K | 768 | 4423 | 10176 |
100-199K | 501 | 2767 | 6438 | |
200-299K | 85 | 809 | 1445 | |
300-399K | 82 | 393 | 753 | |
400-499K | 27 | 148 | 268 | |
500K+ | 51 | 140 | 229 | |
Total Working Age Population | 12,897 | 49,455 | 104,315 | |
In Work Force | 6,236 | 27,478 | 60,564 | |
Not In Work Force | 6,661 | 21,978 | 43,751 | |
Workforce Employed | 5,748 | 24,793 | 52,164 | |
Workforce Unemployed | 463 | 2,252 | 4,674 | |
Civlian Workforce | 6,211 | 27,045 | 56,838 | |
Military Workforce | 25 | 432 | 3,726 | |
Total Households | 5,737 | 23,097 | 47,780 | |
Family Households | 2,774 | 13,146 | 28,832 | |
Non-Family Households | 2,963 | 9,951 | 18,948 | |
Married Couple | 1,552 | 7,848 | 17,410 | |
Other Family | 1,222 | 5,298 | 11,422 | |
Married w/Child | 409 | 2,757 | 6,564 | |
Single Male w/Child | 83 | 367 | 971 | |
Single Female w/Child | 348 | 1,826 | 3,875 |
Population Change Last Two Decades - Plus Projection
2000 | % | 2010 | % | 2020 | % | 2030 | |
---|---|---|---|---|---|---|---|
Texas | 20,851,820 | +21 | 25,145,561 | +18 | 29,677,668 | +18 | 34,894,452 |
El Paso County | 679,622 | +18 | 800,647 | +9 | 876,120 | +7 | 936,697 |
New Mexico | 1,819,046 | +13 | 2,059,179 | +6 | 2,187,183 | +6 | 2,308,475 |
Doña Ana County | 174,682 | +20 | 209,233 | +11 | 232,946 | +9 | 255,070 |
Total Working Age Population:
Total Households:
Total Working Age Population:
Total Households:
Total Working Age Population:
Total Households: