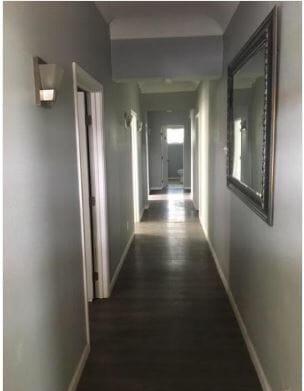
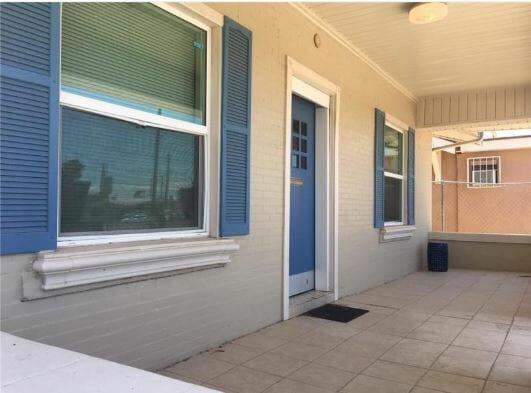
1-Mile | 3-Miles | 5-Miles | ||
---|---|---|---|---|
Total Population | 13,378 | 81,694 | 142,505 | |
Population Median Age | 41 | 40 | 37 | |
Population by Age | 0-9 Yrs | 1346 (10%) | 8806 (10%) | 18800 (13%) |
10-19 Yrs | 1795 (13%) | 10490 (12%) | 18300 (12%) | |
20-29 Yrs | 1641 (12%) | 12965 (15%) | 26695 (18%) | |
30-39 Yrs | 1854 (13%) | 9960 (12%) | 17925 (12%) | |
40-49 Yrs | 1506 (11%) | 8815 (10%) | 14076 (9%) | |
50-59 Yrs | 1859 (13%) | 10737 (13%) | 16987 (11%) | |
60-69 Yrs | 1432 (10%) | 8654 (10%) | 13268 (9%) | |
70+ Yrs | 1944 (14%) | 11267 (13%) | 16454 (11%) | |
Median HH Income | $25,568 | $27,768 | $31,763 | |
Total Household Income | < 24K | 2422 (49%) | 14074 (46%) | 20969 (41%) |
25-49K | 1358 (27%) | 8206 (26%) | 14305 (28%) | |
50-74K | 456 (9%) | 3415 (11%) | 7013 (13%) | |
75-99K | 390 (7%) | 1805 (5%) | 3371 (6%) | |
100-199K | 187 (3%) | 2388 (7%) | 4086 (8%) | |
200K+ | 90 (1%) | 508 (1%) | 974 (1%) | |
Highest Education Level | No Diploma | 3754 | 19425 | 28054 |
Diploma or GED | 2218 | 11478 | 20031 | |
Some College | 1880 | 11016 | 18514 | |
Assoc. Degree | 393 | 3453 | 6466 | |
Bachelors Degree | 782 | 6743 | 12562 | |
Higher Degree | 394 | 3708 | 6226 | |
Total Housing Units | 6,023 | 35,691 | 58,712 | |
--Owner-Occupied | 1,794 | 12,981 | 20,114 | |
--Renter-Occupied | 3,111 | 17,416 | 30,604 | |
Owner-Occupied Values | < 100K | 1024 | 7037 | 10808 |
100-199K | 632 | 4242 | 6576 | |
200-299K | 66 | 932 | 1447 | |
300-399K | 57 | 477 | 774 | |
400-499K | 10 | 152 | 277 | |
500K+ | 4 | 141 | 233 | |
Total Working Age Population | 10,995 | 66,516 | 112,645 | |
In Work Force | 5,773 | 36,719 | 66,388 | |
Not In Work Force | 5,221 | 29,797 | 46,257 | |
Workforce Employed | 5,255 | 32,968 | 55,071 | |
Workforce Unemployed | 475 | 2,896 | 4,905 | |
Civlian Workforce | 5,730 | 35,864 | 59,975 | |
Military Workforce | 43 | 855 | 6,412 | |
Total Households | 4,905 | 30,397 | 50,718 | |
Family Households | 2,931 | 17,786 | 30,896 | |
Non-Family Households | 1,974 | 12,611 | 19,823 | |
Married Couple | 1,612 | 10,531 | 18,808 | |
Other Family | 1,319 | 7,255 | 12,087 | |
Married w/Child | 464 | 3,607 | 7,484 | |
Single Male w/Child | 76 | 454 | 978 | |
Single Female w/Child | 413 | 2,301 | 4,099 |
Population Change Last Two Decades - Plus Projection
2000 | % | 2010 | % | 2020 | % | 2030 | |
---|---|---|---|---|---|---|---|
Texas | 20,851,820 | +21 | 25,145,561 | +18 | 29,677,668 | +18 | 34,894,452 |
El Paso County | 679,622 | +18 | 800,647 | +9 | 876,120 | +7 | 936,697 |
New Mexico | 1,819,046 | +13 | 2,059,179 | +6 | 2,187,183 | +6 | 2,308,475 |
Doña Ana County | 174,682 | +20 | 209,233 | +11 | 232,946 | +9 | 255,070 |
Total Working Age Population:
Total Households:
Total Working Age Population:
Total Households:
Total Working Age Population:
Total Households: