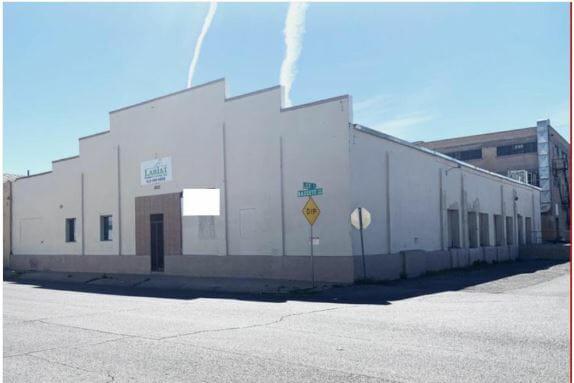
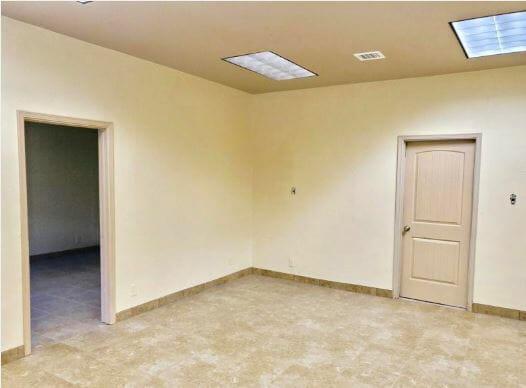
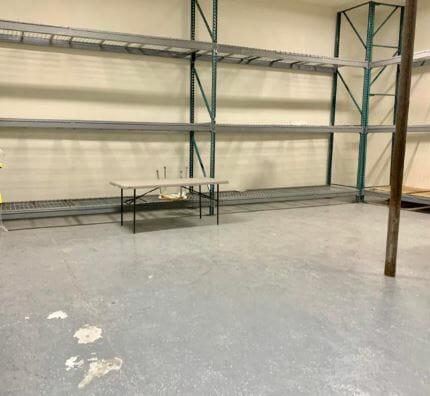
1-Mile | 3-Miles | 5-Miles | ||
---|---|---|---|---|
Total Population | 13,697 | 70,023 | 129,800 | |
Population Median Age | 41 | 40 | 38 | |
Population by Age | 0-9 Yrs | 1592 (11%) | 7659 (10%) | 16343 (12%) |
10-19 Yrs | 1786 (13%) | 9445 (13%) | 16637 (12%) | |
20-29 Yrs | 1795 (13%) | 10386 (14%) | 23422 (18%) | |
30-39 Yrs | 1712 (12%) | 8244 (11%) | 16291 (12%) | |
40-49 Yrs | 1441 (10%) | 7594 (10%) | 13110 (10%) | |
50-59 Yrs | 1846 (13%) | 9245 (13%) | 15742 (12%) | |
60-69 Yrs | 1586 (11%) | 7512 (10%) | 12389 (9%) | |
70+ Yrs | 1939 (14%) | 9938 (14%) | 15866 (12%) | |
Median HH Income | $18,526 | $25,971 | $30,242 | |
Total Household Income | < 24K | 3212 (63%) | 12621 (48%) | 20032 (43%) |
25-49K | 1243 (24%) | 6860 (26%) | 13219 (28%) | |
50-74K | 282 (5%) | 2759 (10%) | 6129 (13%) | |
75-99K | 192 (3%) | 1421 (5%) | 2954 (6%) | |
100-199K | 97 (1%) | 1782 (6%) | 3324 (7%) | |
200K+ | 53 (1%) | 466 (1%) | 745 (1%) | |
Highest Education Level | No Diploma | 4648 | 17556 | 27542 |
Diploma or GED | 2136 | 9951 | 18855 | |
Some College | 1553 | 8901 | 16806 | |
Assoc. Degree | 340 | 2804 | 5754 | |
Bachelors Degree | 552 | 5337 | 10529 | |
Higher Degree | 177 | 3057 | 5267 | |
Total Housing Units | 6,091 | 30,397 | 53,853 | |
--Owner-Occupied | 1,194 | 10,928 | 18,915 | |
--Renter-Occupied | 3,885 | 14,980 | 27,488 | |
Owner-Occupied Values | < 100K | 865 | 6007 | 10862 |
100-199K | 283 | 3450 | 5947 | |
200-299K | 22 | 762 | 1122 | |
300-399K | 23 | 430 | 602 | |
400-499K | 0 | 145 | 194 | |
500K+ | 3 | 134 | 188 | |
Total Working Age Population | 11,113 | 56,615 | 103,492 | |
In Work Force | 5,128 | 30,461 | 60,064 | |
Not In Work Force | 5,985 | 26,154 | 43,428 | |
Workforce Employed | 4,562 | 27,519 | 50,517 | |
Workforce Unemployed | 553 | 2,618 | 4,605 | |
Civlian Workforce | 5,114 | 30,137 | 55,122 | |
Military Workforce | 13 | 325 | 4,942 | |
Total Households | 5,079 | 25,909 | 46,402 | |
Family Households | 2,797 | 15,312 | 28,185 | |
Non-Family Households | 2,282 | 10,597 | 18,218 | |
Married Couple | 1,509 | 8,872 | 16,748 | |
Other Family | 1,288 | 6,440 | 11,436 | |
Married w/Child | 428 | 3,081 | 6,346 | |
Single Male w/Child | 68 | 436 | 855 | |
Single Female w/Child | 553 | 2,090 | 3,768 |
Population Change Last Two Decades - Plus Projection
2000 | % | 2010 | % | 2020 | % | 2030 | |
---|---|---|---|---|---|---|---|
Texas | 20,851,820 | +21 | 25,145,561 | +18 | 29,677,668 | +18 | 34,894,452 |
El Paso County | 679,622 | +18 | 800,647 | +9 | 876,120 | +7 | 936,697 |
New Mexico | 1,819,046 | +13 | 2,059,179 | +6 | 2,187,183 | +6 | 2,308,475 |
Doña Ana County | 174,682 | +20 | 209,233 | +11 | 232,946 | +9 | 255,070 |
Total Working Age Population:
Total Households:
Total Working Age Population:
Total Households:
Total Working Age Population:
Total Households: