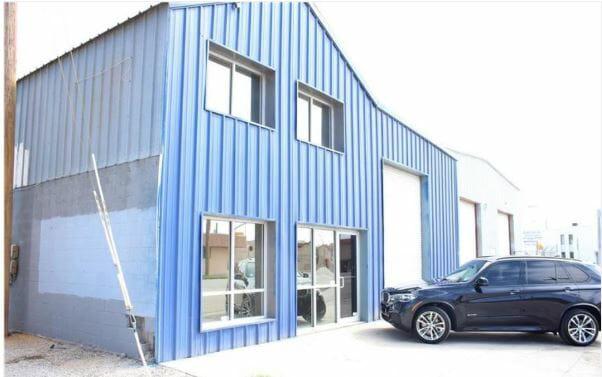
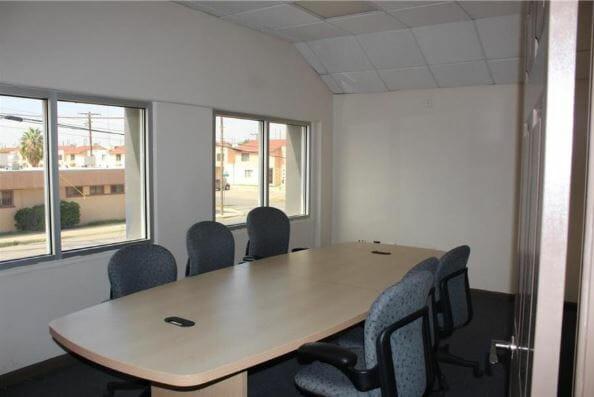
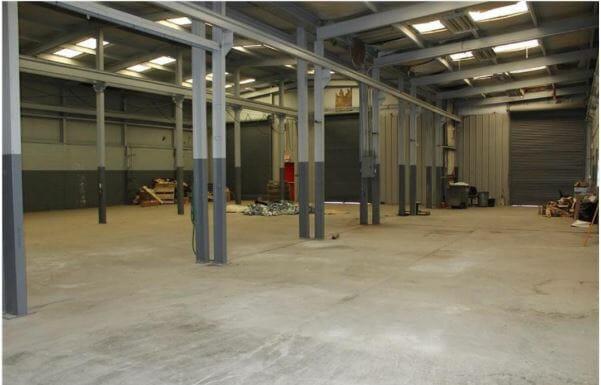
Excellent Commercial Property located near the Free Bridge & Border Highway. Great downtown access, South Central, Metal & Block Building on a Corner Lot, 4 Bay Machine Shop with Overhead Cranes, 4 Street Level Drive-in Doors, 3 Phase Power. Great for Storage, Machine Shop, Body Shop. 3 business offices,restroom and conference room. 1 office and restroom in warehouse area. Corner of Paisano & Eucalyptus!Primary FeaturesCounty El PasoOff Market DateProperty Type CommercialSold DateSold PriceSubdivision BassettZoning C4Financial DetailsApproximate Yearly Taxes 5789Exemptions UnknownLease Info NoneLease Terms SaleLeaseable Area Y/N noNumber Of TenantsPackages IncludesSale IncludesBuilding and Land, Equipment, Fixtures, FurnishingsTax Year 2018Tenant Pays N/AAdditionalBest UseDistribution, Industrial, Professional/Office, WarehouseEmpowerment Zone YesImproved YesMeasured By Appraiser CADProperty Building, Other ImprovementsSource Dimensions OtherVerification OtherExternal FeaturesConstruction Aluminum Siding, Block, See RemarksDock YesFinance Considered Cash, ConventionalHandicap Access YesLotLot SqFt 10123Miscellaneous Exterior FencedNumber Of Parking Spaces 15Parking On Street, See RemarksProperty Access Paved Road to PropUtilitiesAll City, Electricity Available, Heavy Electric, Natural GasInterior FeaturesCooling 2+ Units, RefrigeratedFinished SpaceHeating 2+ Units, Natural Gas, ZonedRefrigeratedLocation InformationFlood Zone NoLocation Corner Lot, Freestanding