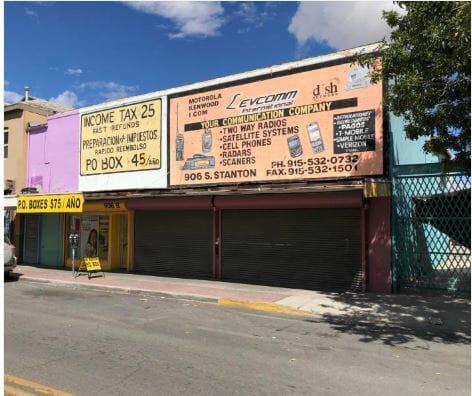
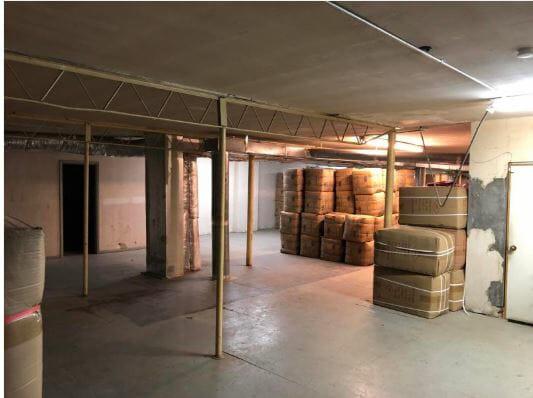
1-Mile | 3-Miles | 5-Miles | ||
---|---|---|---|---|
Total Population | 8,565 | 41,343 | 102,726 | |
Population Median Age | 41 | 40 | 40 | |
Population by Age | 0-9 Yrs | 838 (9%) | 4281 (10%) | 11653 (11%) |
10-19 Yrs | 1143 (13%) | 5534 (13%) | 13224 (12%) | |
20-29 Yrs | 1327 (15%) | 6231 (15%) | 16806 (16%) | |
30-39 Yrs | 858 (10%) | 5012 (12%) | 12653 (12%) | |
40-49 Yrs | 1048 (12%) | 4581 (11%) | 10822 (10%) | |
50-59 Yrs | 1036 (12%) | 5589 (13%) | 13141 (12%) | |
60-69 Yrs | 1017 (11%) | 4453 (10%) | 10487 (10%) | |
70+ Yrs | 1298 (15%) | 5662 (13%) | 13940 (13%) | |
Median HH Income | $15,847 | $23,092 | $28,298 | |
Total Household Income | < 24K | 2346 (71%) | 8345 (53%) | 17319 (45%) |
25-49K | 672 (20%) | 3701 (23%) | 10458 (27%) | |
50-74K | 155 (4%) | 1452 (9%) | 4496 (11%) | |
75-99K | 48 (1%) | 738 (4%) | 2290 (6%) | |
100-199K | 26 (0%) | 937 (6%) | 2750 (7%) | |
200K+ | 16 (0%) | 355 (2%) | 594 (1%) | |
Highest Education Level | No Diploma | 3372 | 11218 | 23860 |
Diploma or GED | 1146 | 5543 | 14997 | |
Some College | 727 | 4999 | 13621 | |
Assoc. Degree | 244 | 1422 | 4442 | |
Bachelors Degree | 292 | 3014 | 8109 | |
Higher Degree | 109 | 1974 | 4372 | |
Total Housing Units | 3,795 | 18,511 | 44,253 | |
--Owner-Occupied | 385 | 5,028 | 16,169 | |
--Renter-Occupied | 2,877 | 10,499 | 21,739 | |
Owner-Occupied Values | < 100K | 313 | 2626 | 9314 |
100-199K | 25 | 1479 | 5032 | |
200-299K | 40 | 459 | 993 | |
300-399K | 0 | 218 | 511 | |
400-499K | 0 | 127 | 162 | |
500K+ | 8 | 119 | 156 | |
Total Working Age Population | 7,057 | 33,793 | 83,068 | |
In Work Force | 2,962 | 17,584 | 46,416 | |
Not In Work Force | 4,095 | 16,209 | 36,652 | |
Workforce Employed | 2,551 | 15,987 | 41,160 | |
Workforce Unemployed | 404 | 1,468 | 3,585 | |
Civlian Workforce | 2,955 | 17,455 | 44,745 | |
Military Workforce | 7 | 129 | 1,671 | |
Total Households | 3,262 | 15,527 | 37,907 | |
Family Households | 1,635 | 8,903 | 22,542 | |
Non-Family Households | 1,627 | 6,624 | 15,365 | |
Married Couple | 875 | 5,144 | 13,308 | |
Other Family | 761 | 3,759 | 9,234 | |
Married w/Child | 280 | 1,667 | 4,698 | |
Single Male w/Child | 28 | 223 | 677 | |
Single Female w/Child | 324 | 1,357 | 2,900 |
Population Change Last Two Decades - Plus Projection
2000 | % | 2010 | % | 2020 | % | 2030 | |
---|---|---|---|---|---|---|---|
Texas | 20,851,820 | +21 | 25,145,561 | +18 | 29,677,668 | +18 | 34,894,452 |
El Paso County | 679,622 | +18 | 800,647 | +9 | 876,120 | +7 | 936,697 |
New Mexico | 1,819,046 | +13 | 2,059,179 | +6 | 2,187,183 | +6 | 2,308,475 |
Doña Ana County | 174,682 | +20 | 209,233 | +11 | 232,946 | +9 | 255,070 |
Total Working Age Population:
Total Households:
Total Working Age Population:
Total Households:
Total Working Age Population:
Total Households: