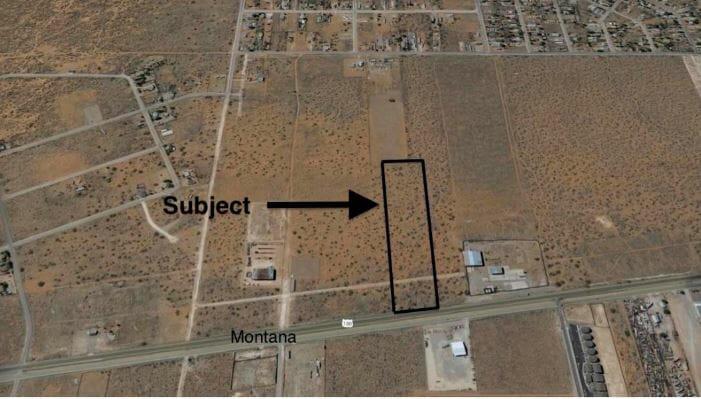
This is a great opportunity for a transportation company or suited for a wide variety of uses with no zoning ordinance as of this posting but subject to change. This unimproved land has 370' of frontage on US Route 180 (Montana). The traffic on US Route 180 (Montana) will give you great visibility and the City of El Paso is growing in this direction. Only PRICED AT $0.99 SQFT. The property is also available for lease and the lease rate is $1,500 /Month. That is less than $0.01 sqft. The seller will allow for rent collected to be contributed to down payment. Owner will consider seller financing or lease option to buy. Just over 3 miles east of Zaragoza and located in Home Meadows South district.Primary FeaturesCounty El PasoOff Market DateProperty Type CommercialSold DateSold PriceSubdivision Montana PalmsZoning RRFinancial DetailsApproximate Yearly Taxes 4302Exemptions NoneLease InfoLease Terms12 Months, 24 Months, 6 Months, For Lease, Lease Option, Lease Purchase, Month to Month, NegotiableLeaseable Area Y/N yesNumber Of Tenants 0Packages IncludesSale IncludesTax Year 2019Tenant PaysAdditionalBest UseDeveloped Land, Distribution, Industrial, See RemarksEmpowerment Zone NoImproved NoMeasured By Appraiser CADProperty Land (Fee Simple), See RemarksSource Dimensions Owner ProvidedVerification OtherExternal FeaturesConstructionDockFinance ConsideredBalloon Payment, Buy Down, Cash, Conventional, Lease Option, Lease Purchase, Owner Will Carry, See RemarksHandicap Access NoLotLot SqFt 523835Miscellaneous Exterior See RemarksNumber Of Parking SpacesParkingProperty Access See RemarksUtilities See RemarksInterior FeaturesCoolingFinished SpaceHeating See RemarksRefrigeratedLocation InformationFlood Zone No