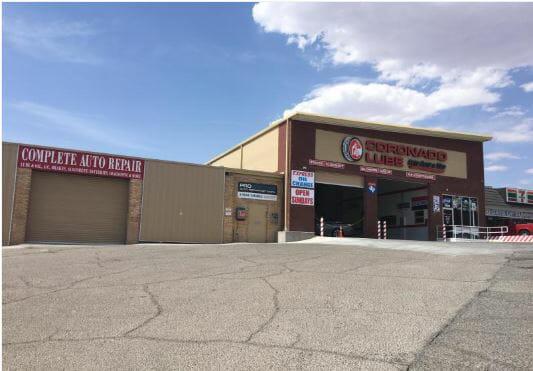
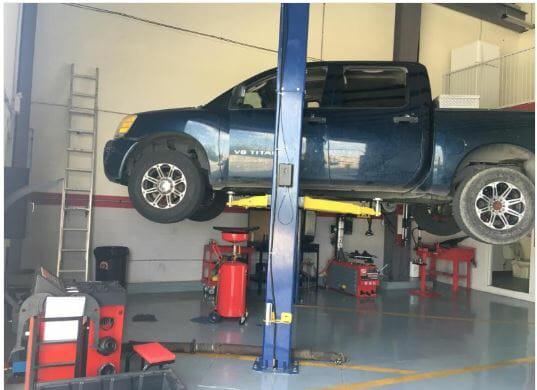
1-Mile | 3-Miles | 5-Miles | ||
---|---|---|---|---|
Total Population | 16,388 | 85,750 | 148,862 | |
Population Median Age | 37 | 36 | 35 | |
Population by Age | 0-9 Yrs | 2408 (14%) | 12582 (14%) | 23019 (15%) |
10-19 Yrs | 2089 (12%) | 12249 (14%) | 21500 (14%) | |
20-29 Yrs | 2366 (14%) | 13267 (15%) | 22843 (15%) | |
30-39 Yrs | 2190 (13%) | 10962 (12%) | 19566 (13%) | |
40-49 Yrs | 1991 (12%) | 10731 (12%) | 18862 (12%) | |
50-59 Yrs | 1967 (12%) | 10841 (12%) | 17951 (12%) | |
60-69 Yrs | 1734 (10%) | 7828 (9%) | 13188 (8%) | |
70+ Yrs | 1644 (10%) | 7291 (8%) | 11934 (8%) | |
Median HH Income | $60,020 | $58,888 | $57,474 | |
Total Household Income | < 24K | 1137 (18%) | 6447 (21%) | 11734 (23%) |
25-49K | 1330 (22%) | 6260 (20%) | 10788 (21%) | |
50-74K | 956 (15%) | 5284 (17%) | 8507 (16%) | |
75-99K | 910 (15%) | 3470 (11%) | 5692 (11%) | |
100-199K | 1313 (21%) | 6479 (21%) | 11001 (21%) | |
200K+ | 354 (5%) | 2007 (6%) | 3219 (6%) | |
Highest Education Level | No Diploma | 690 | 6325 | 12889 |
Diploma or GED | 1628 | 8649 | 15740 | |
Some College | 2242 | 10521 | 18699 | |
Assoc. Degree | 763 | 3978 | 6874 | |
Bachelors Degree | 3032 | 14910 | 23344 | |
Higher Degree | 2221 | 9708 | 15208 | |
Total Housing Units | 6,693 | 33,480 | 57,175 | |
--Owner-Occupied | 3,391 | 16,639 | 29,605 | |
--Renter-Occupied | 2,608 | 13,309 | 21,336 | |
Owner-Occupied Values | < 100K | 168 | 1320 | 4195 |
100-199K | 1551 | 8342 | 13207 | |
200-299K | 1226 | 4281 | 7259 | |
300-399K | 290 | 1491 | 2876 | |
400-499K | 61 | 611 | 987 | |
500K+ | 95 | 593 | 1081 | |
Total Working Age Population | 12,790 | 66,003 | 113,230 | |
In Work Force | 8,389 | 42,811 | 73,242 | |
Not In Work Force | 4,401 | 23,192 | 39,988 | |
Workforce Employed | 7,775 | 39,596 | 67,339 | |
Workforce Unemployed | 520 | 2,535 | 4,176 | |
Civlian Workforce | 8,295 | 42,131 | 71,515 | |
Military Workforce | 95 | 680 | 1,727 | |
Total Households | 6,000 | 29,948 | 50,941 | |
Family Households | 4,054 | 20,261 | 35,250 | |
Non-Family Households | 1,945 | 9,687 | 15,690 | |
Married Couple | 3,090 | 14,544 | 25,695 | |
Other Family | 964 | 5,716 | 9,555 | |
Married w/Child | 1,267 | 6,409 | 11,590 | |
Single Male w/Child | 174 | 619 | 902 | |
Single Female w/Child | 346 | 2,206 | 3,806 |
Population Change Last Two Decades - Plus Projection
2000 | % | 2010 | % | 2020 | % | 2030 | |
---|---|---|---|---|---|---|---|
Texas | 20,851,820 | +21 | 25,145,561 | +18 | 29,677,668 | +18 | 34,894,452 |
El Paso County | 679,622 | +18 | 800,647 | +9 | 876,120 | +7 | 936,697 |
New Mexico | 1,819,046 | +13 | 2,059,179 | +6 | 2,187,183 | +6 | 2,308,475 |
Doña Ana County | 174,682 | +20 | 209,233 | +11 | 232,946 | +9 | 255,070 |
Total Working Age Population:
Total Households:
Total Working Age Population:
Total Households:
Total Working Age Population:
Total Households: