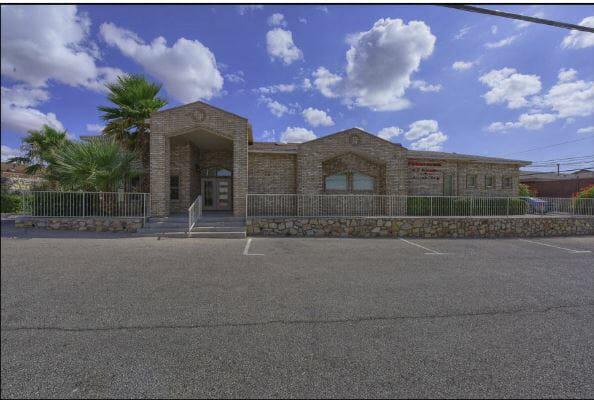
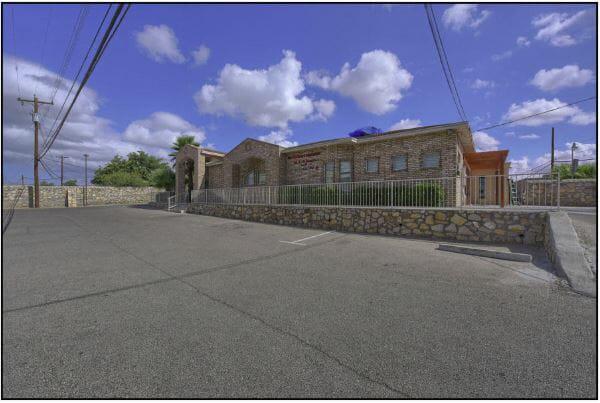
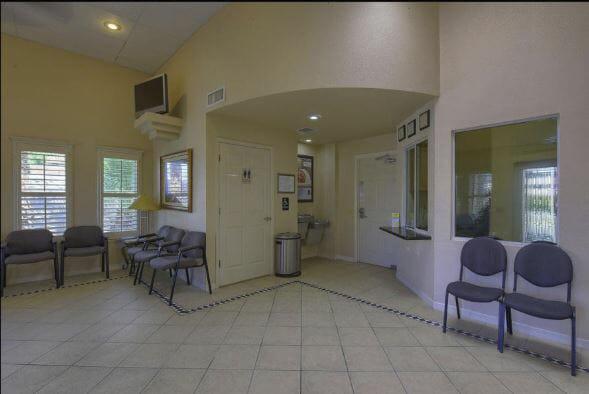
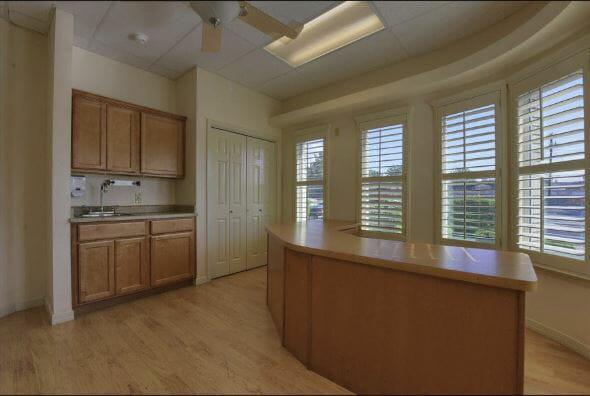
1-Mile | 3-Miles | 5-Miles | ||
---|---|---|---|---|
Total Population | 16,176 | 122,902 | 256,133 | |
Population Median Age | 41 | 39 | 37 | |
Population by Age | 0-9 Yrs | 1789 (11%) | 14631 (11%) | 31719 (12%) |
10-19 Yrs | 1851 (11%) | 17135 (13%) | 38668 (15%) | |
20-29 Yrs | 2503 (15%) | 18629 (15%) | 42181 (16%) | |
30-39 Yrs | 1802 (11%) | 13619 (11%) | 28704 (11%) | |
40-49 Yrs | 1873 (11%) | 14908 (12%) | 30720 (11%) | |
50-59 Yrs | 2313 (14%) | 15787 (12%) | 32565 (12%) | |
60-69 Yrs | 1433 (8%) | 12182 (9%) | 24533 (9%) | |
70+ Yrs | 2611 (16%) | 16011 (13%) | 27043 (10%) | |
Median HH Income | $39,569 | $41,443 | $42,203 | |
Total Household Income | < 24K | 1861 (30%) | 13044 (30%) | 24934 (29%) |
25-49K | 1914 (31%) | 12598 (29%) | 24566 (28%) | |
50-74K | 1124 (18%) | 8022 (18%) | 16174 (18%) | |
75-99K | 462 (7%) | 4157 (9%) | 8445 (9%) | |
100-199K | 544 (9%) | 4598 (10%) | 9534 (11%) | |
200K+ | 128 (2%) | 861 (1%) | 1501 (1%) | |
Highest Education Level | No Diploma | 2684 | 17600 | 36010 |
Diploma or GED | 2755 | 21550 | 44140 | |
Some College | 2602 | 19937 | 39706 | |
Assoc. Degree | 924 | 5623 | 12170 | |
Bachelors Degree | 1525 | 10756 | 21391 | |
Higher Degree | 745 | 5197 | 9263 | |
Total Housing Units | 6,684 | 47,082 | 92,361 | |
--Owner-Occupied | 3,366 | 25,203 | 51,366 | |
--Renter-Occupied | 2,667 | 18,077 | 33,788 | |
Owner-Occupied Values | < 100K | 1552 | 9502 | 19726 |
100-199K | 1247 | 13065 | 26751 | |
200-299K | 450 | 2008 | 3484 | |
300-399K | 73 | 376 | 907 | |
400-499K | 9 | 32 | 67 | |
500K+ | 35 | 220 | 431 | |
Total Working Age Population | 13,293 | 98,167 | 201,925 | |
In Work Force | 7,613 | 57,798 | 122,236 | |
Not In Work Force | 5,680 | 40,369 | 79,689 | |
Workforce Employed | 7,160 | 52,347 | 109,750 | |
Workforce Unemployed | 225 | 4,000 | 8,075 | |
Civlian Workforce | 7,384 | 56,347 | 117,825 | |
Military Workforce | 229 | 1,451 | 4,411 | |
Total Households | 6,033 | 43,280 | 85,154 | |
Family Households | 4,079 | 30,224 | 60,822 | |
Non-Family Households | 1,954 | 13,056 | 24,332 | |
Married Couple | 2,458 | 18,926 | 38,255 | |
Other Family | 1,622 | 11,297 | 22,567 | |
Married w/Child | 769 | 6,826 | 15,144 | |
Single Male w/Child | 30 | 555 | 1,873 | |
Single Female w/Child | 487 | 4,213 | 8,241 |
Population Change Last Two Decades - Plus Projection
2000 | % | 2010 | % | 2020 | % | 2030 | |
---|---|---|---|---|---|---|---|
Texas | 20,851,820 | +21 | 25,145,561 | +18 | 29,677,668 | +18 | 34,894,452 |
El Paso County | 679,622 | +18 | 800,647 | +9 | 876,120 | +7 | 936,697 |
Total Working Age Population:
Total Households:
Total Working Age Population:
Total Households:
Total Working Age Population:
Total Households: