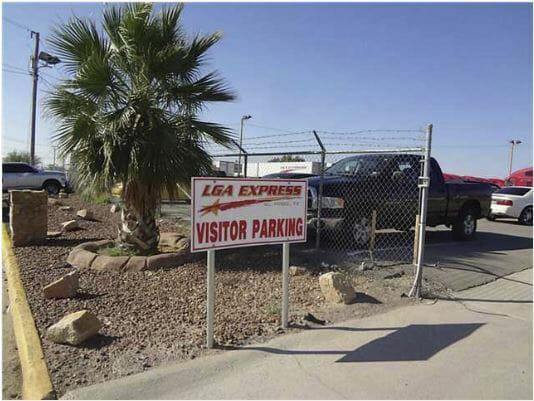
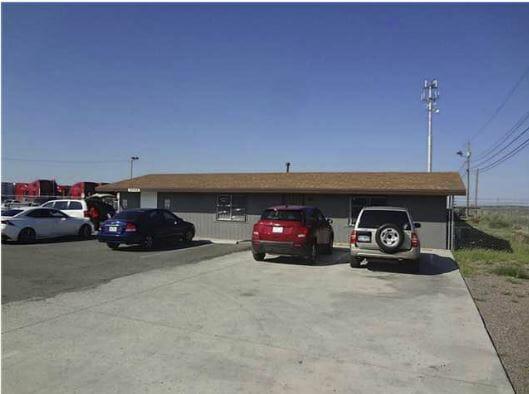
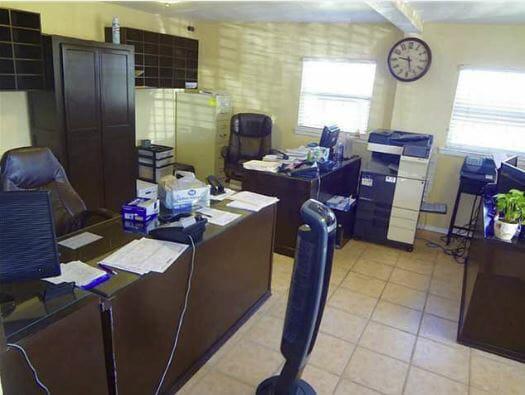
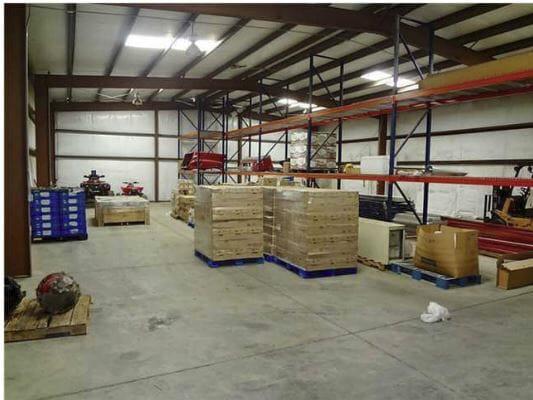
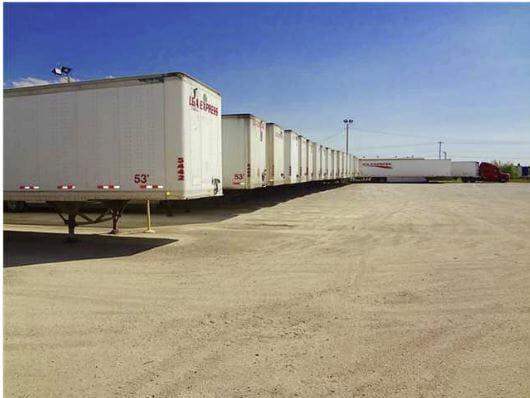
Property Description:Turn Key Logistical Center! Currently set up for a trucking business, with all the bell and whistles. 4000 sqft of Office space w/ conference room and over 5 Bathrooms. Lg Warehouse space w/ 3 Docks, Upgraded Internet, Maintenance & Tool Shop made for Trucks & Trailers. Furniture can be included with list price. Customer and employee parking apx. 60 Cars, over 140 Trailers & 60+ Trucks. Rent to Own Available! Wow! Call Today for info!Primary FeaturesCounty: El PasoOff Market Date:Property Type: CommercialSold Date:Sold Price:Subdivision:Zoning: M1Financial DetailsApproximate Yearly Taxes:Exemptions: UnknownLease Info:Lease Terms: SaleLeaseable Area Y/N: noNumber Of Tenants:Packages Includes:Sale Includes: Building and LandTax Year:Tenant Pays: All UtilitiesAdditionalBest Use: Distribution, See Remarks, WarehouseEmpowerment Zone: NoImproved: YesMeasured By: Appraiser CADProperty: See RemarksSource Dimensions: Owner ProvidedVerification: Information LimitedExternal FeaturesConstruction:Dock: YesFinance Considered: Owner Will CarryHandicap Access: NoLot:Lot SqFt:Miscellaneous Exterior: Fenced, See Remarks, StorageNumber Of Parking Spaces:Parking:Property Access:Utilities:Interior FeaturesCooling: 2+ Units, RefrigeratedFinished Space:Heating: 2+ Units, Central, Forced AirRefrigerated: YesLocation InformationFlood Zone: No