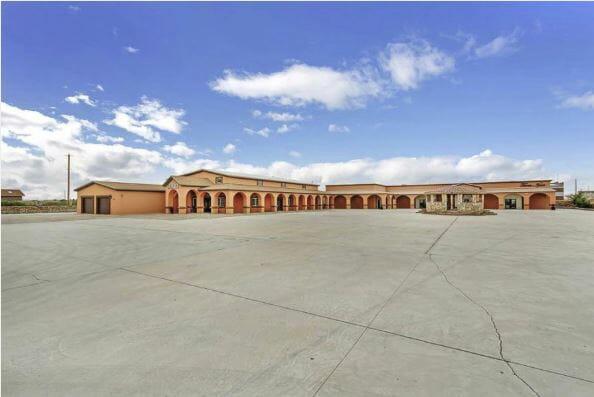
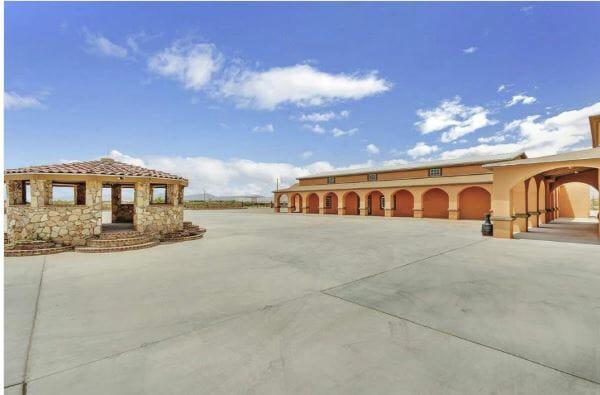
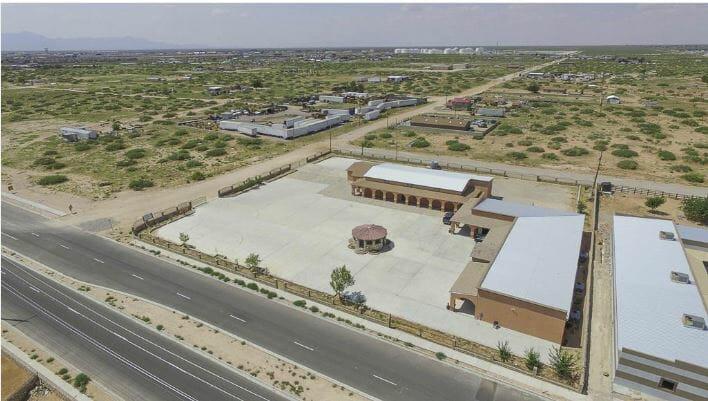
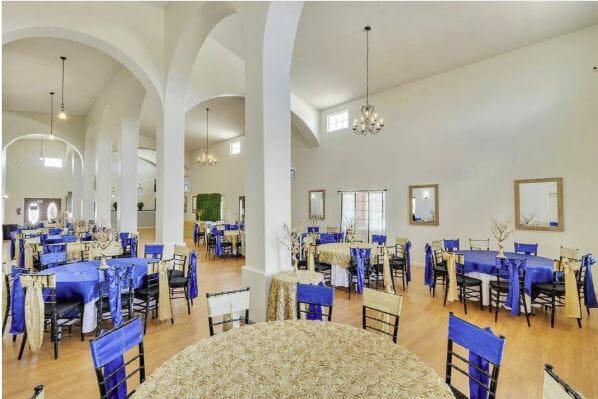
1-Mile | 3-Miles | 5-Miles | ||
---|---|---|---|---|
Total Population | 3,270 | 35,101 | 102,020 | |
Population Median Age | 25 | 28 | 29 | |
Population by Age | 0-9 Yrs | 888 (27%) | 8000 (22%) | 19726 (19%) |
10-19 Yrs | 479 (14%) | 5311 (15%) | 17060 (16%) | |
20-29 Yrs | 450 (13%) | 5539 (15%) | 17704 (17%) | |
30-39 Yrs | 843 (25%) | 6951 (19%) | 17563 (17%) | |
40-49 Yrs | 415 (12%) | 4634 (13%) | 14012 (13%) | |
50-59 Yrs | 109 (3%) | 2557 (7%) | 8480 (8%) | |
60-69 Yrs | 62 (1%) | 1277 (3%) | 4593 (4%) | |
70+ Yrs | 22 (0%) | 832 (2%) | 2881 (2%) | |
Median HH Income | $62,694 | $57,818 | $57,193 | |
Total Household Income | < 24K | 101 (10%) | 1703 (16%) | 4819 (16%) |
25-49K | 183 (18%) | 2302 (22%) | 6827 (23%) | |
50-74K | 310 (31%) | 2721 (26%) | 7024 (24%) | |
75-99K | 158 (16%) | 1370 (13%) | 3961 (13%) | |
100-199K | 211 (21%) | 2158 (20%) | 5289 (18%) | |
200K+ | 16 (1%) | 134 (1%) | 539 (1%) | |
Highest Education Level | No Diploma | 120 | 2850 | 8967 |
Diploma or GED | 244 | 3897 | 11946 | |
Some College | 657 | 5706 | 16517 | |
Assoc. Degree | 186 | 1928 | 5128 | |
Bachelors Degree | 387 | 3498 | 10201 | |
Higher Degree | 137 | 1358 | 3686 | |
Total Housing Units | 1,024 | 11,470 | 30,568 | |
--Owner-Occupied | 852 | 7,521 | 21,204 | |
--Renter-Occupied | 127 | 2,866 | 7,256 | |
Owner-Occupied Values | < 100K | 59 | 1110 | 4428 |
100-199K | 607 | 4762 | 13435 | |
200-299K | 162 | 1329 | 2754 | |
300-399K | 12 | 200 | 372 | |
400-499K | 6 | 49 | 97 | |
500K+ | 6 | 72 | 119 | |
Total Working Age Population | 1,991 | 23,250 | 70,868 | |
In Work Force | 1,580 | 16,507 | 48,497 | |
Not In Work Force | 411 | 6,743 | 22,370 | |
Workforce Employed | 1,375 | 14,257 | 43,669 | |
Workforce Unemployed | 75 | 1,021 | 2,486 | |
Civlian Workforce | 1,450 | 15,278 | 46,154 | |
Military Workforce | 129 | 1,229 | 2,343 | |
Total Households | 978 | 10,387 | 28,460 | |
Family Households | 842 | 8,577 | 23,689 | |
Non-Family Households | 137 | 1,810 | 4,771 | |
Married Couple | 609 | 6,119 | 16,494 | |
Other Family | 233 | 2,458 | 7,195 | |
Married w/Child | 455 | 3,808 | 9,728 | |
Single Male w/Child | 48 | 418 | 1,092 | |
Single Female w/Child | 144 | 1,386 | 3,589 |
Population Change Last Two Decades - Plus Projection
2000 | % | 2010 | % | 2020 | % | 2030 | |
---|---|---|---|---|---|---|---|
Texas | 20,851,820 | +21 | 25,145,561 | +18 | 29,677,668 | +18 | 34,894,452 |
El Paso County | 679,622 | +18 | 800,647 | +9 | 876,120 | +7 | 936,697 |
Total Working Age Population:
Total Households:
Total Working Age Population:
Total Households:
Total Working Age Population:
Total Households: