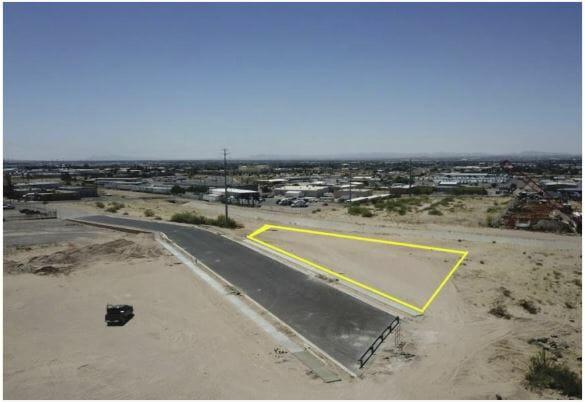
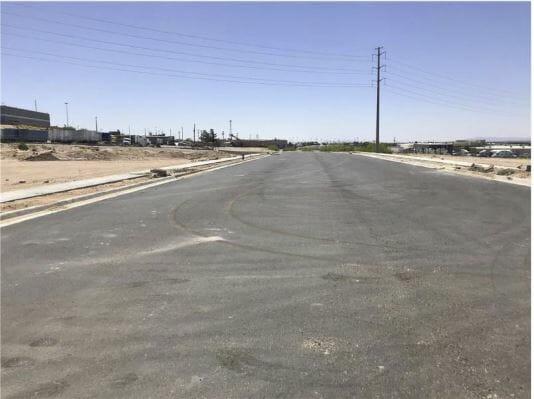
Property Description:This particular parcel would be the South portion of the development facing Yernmoland. This is the perfect location for the person who would like to have his own business with an affordable price. All utilities will be at the front of the lot and a new extension of Yermoland will be built before closing. The owner will owner-finance or we can build to suit.Primary FeaturesCounty: El PasoOff Market Date:Property Type: CommercialSold Date:Sold Price:Subdivision:Zoning: C4Financial DetailsApproximate Yearly Taxes:Exemptions: NoneLease Info: See RemarksLease Terms: SaleLeaseable Area Y/N: yesNumber Of Tenants: 0Packages Includes: Contact LASale Includes: Sale Only, See RemarksTax Year:Tenant Pays: All UtilitiesAdditionalBest Use: Church, Dental, Distribution, Medical, Professional/Office, Showroom, WarehouseEmpowerment Zone: NoImproved: NoMeasured By: OtherProperty: Land (Fee Simple), See RemarksSource Dimensions: Owner ProvidedVerification: OtherExternal FeaturesConstruction: See RemarksDock:Finance Considered: Cash, Seller AssistedHandicap Access: YesLot:Lot SqFt: 39204Miscellaneous Exterior: See RemarksNumber Of Parking Spaces:Parking: NoneProperty Access: Graded Road, Paved Road to PropUtilities: All CityInterior FeaturesCooling: NoneFinished Space:Heating: See RemarksRefrigerated:Location InformationFlood Zone: NoLocation: Industrial Park, Inside