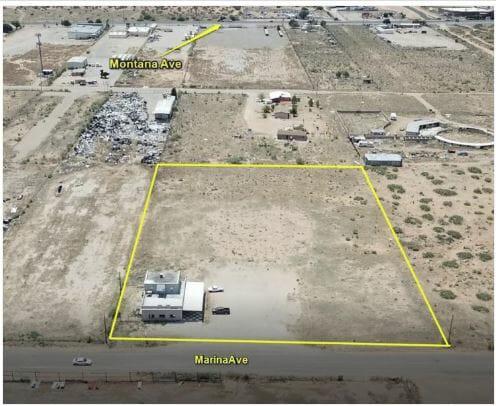
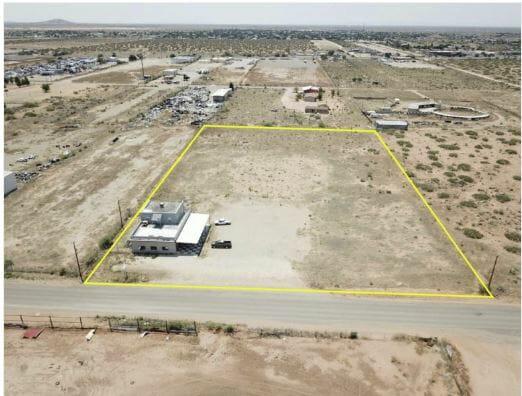
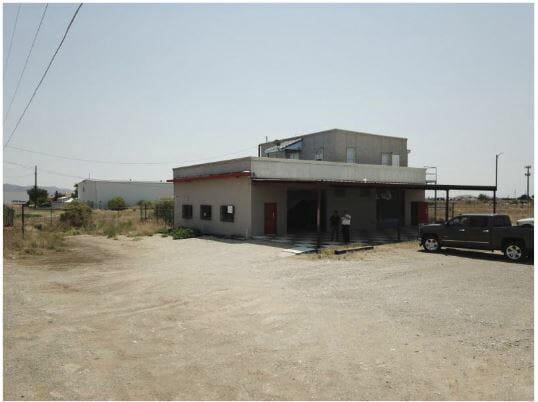
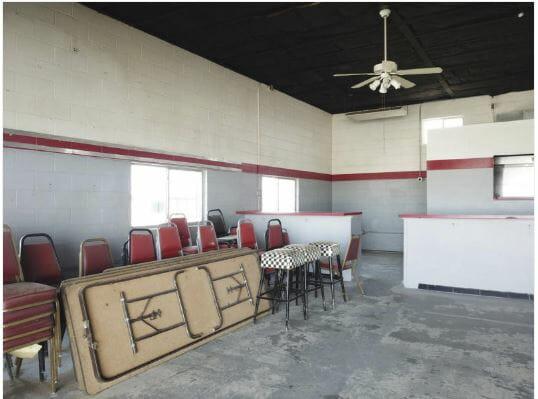
Property Description:Located in the far East El Paso, 2,400 square feet. Commercial Building. Can easily be expanded to 3,600 sf. This building hasover head garage doors with many possible uses! Previously a Bar & Grill, it has County permits and a small kitchen set up. Upstairs there is a 2 bedroom studio apartment that has approximately 1,020 square feet. Living space with a great view from the balcony. Run your business downstairs, live upstairs ! All on almost 4 acres. Price reduced from $350,000. See it today!Primary FeaturesCounty: El PasoOff Market Date:Property Type: CommercialSold Date:Sold Price:Subdivision:Zoning: C1Financial DetailsApproximate Yearly Taxes:Exemptions: UnknownLease Info:Lease Terms: NoneLeaseable Area Y/N:Number Of Tenants: 0Packages Includes:Sale Includes:Tax Year:Tenant Pays:AdditionalBest Use:Empowerment Zone: NoImproved: YesMeasured By: OwnerProperty: Building, Land (Fee Simple), See RemarksSource Dimensions: Owner ProvidedVerification: Actual RecordsExternal FeaturesConstruction:Dock:Finance Considered:Handicap Access: NoLot:Lot SqFt: 174236Miscellaneous Exterior:Number Of Parking Spaces:Parking:Property Access:Utilities:Interior FeaturesCooling:Finished Space:Heating: Forced AirRefrigerated:Location InformationFlood Zone: No