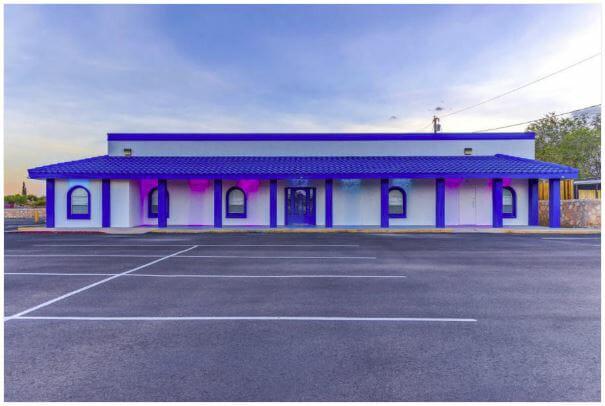
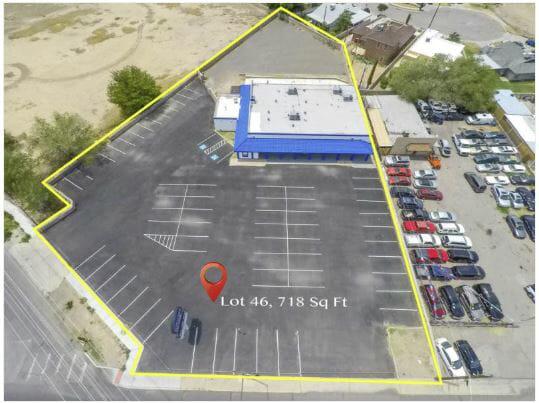
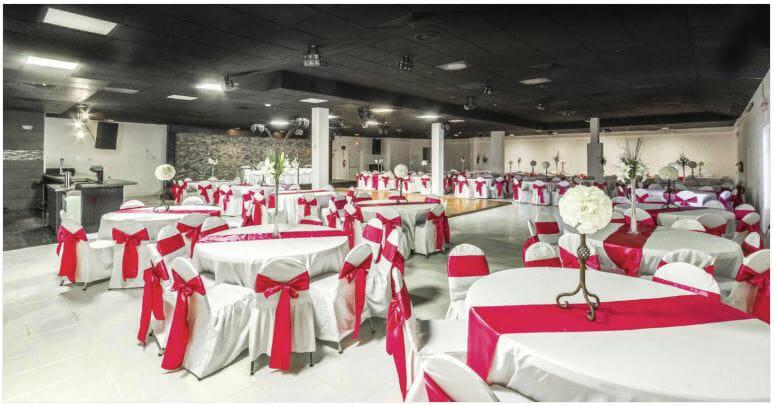
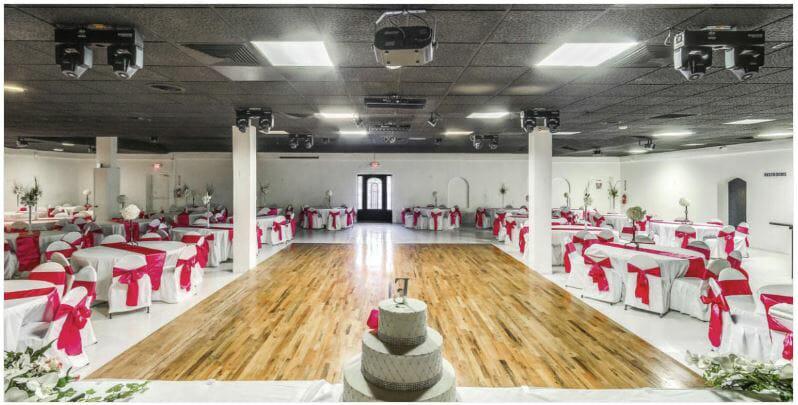
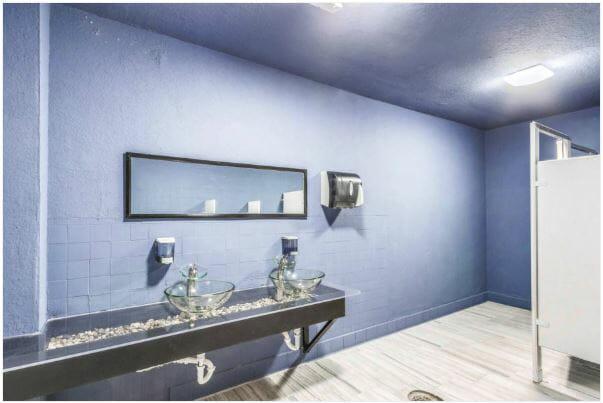
Property Description:Ballroom with capacity of 331 on major highway, corner lot, with paved parking, and major upgrades to include: 4 Refrigeration units, top of the line synchronized lighting and music system, separate dance floor, refreshment bar,Kitchen and walk-in refrigerator, upgraded bathrooms, security system, outdoor sign, tables, chairs, linens, decorations, and much more. This building is in tip top shape and does have future contracts pending for large gatherings.Easy to show, please call or text 269-1550 or 491-9858 for showing appointment. Business itinerary to convey with sale. 2 parcels total of 1.4605 ACPrimary FeaturesCounty: El PasoOff Market Date:Property Type: CommercialSold Date:Sold Price:Subdivision:Zoning: C2Financial DetailsApproximate Yearly Taxes:Exemptions: UnknownLease Info:Lease Terms: NoneLeaseable Area Y/N:Number Of Tenants: 0Packages Includes:Sale Includes:Tax Year:Tenant Pays: NoneAdditionalBest Use: Bar/Tavern/LoungeEmpowerment Zone: NoImproved: YesMeasured By: OtherProperty: BuildingSource Dimensions: OtherVerification: OtherExternal FeaturesConstruction: MasonryDock:Finance Considered: 1031 Exchange, Balloon Payment, CashHandicap Access: YesLot:Lot SqFt: 63597Miscellaneous Exterior:Number Of Parking Spaces:Parking: See RemarksProperty Access: Paved Road to PropUtilities: All CityInterior FeaturesCooling: