Commercial Land
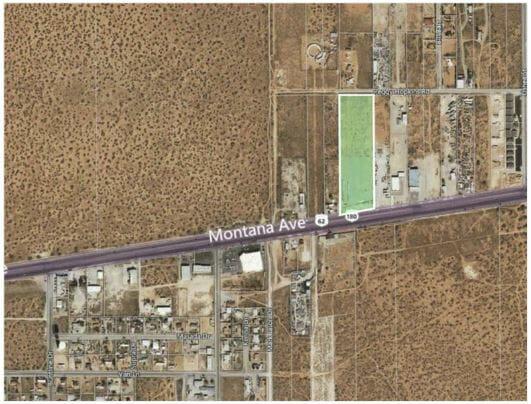
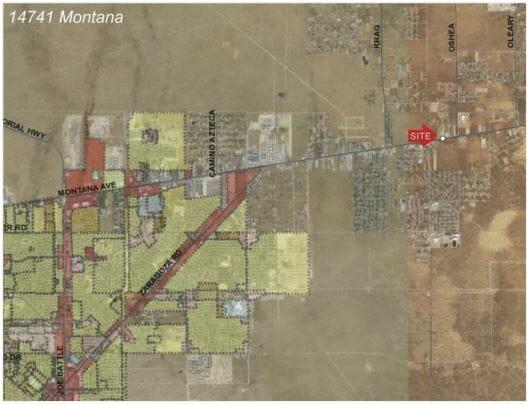
14741 Montana Avenue El Paso, TX 79938
14741 Montana Avenue El Paso, TX 79938
Details & Description
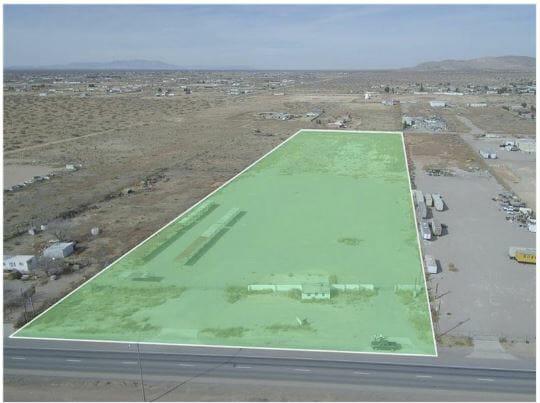
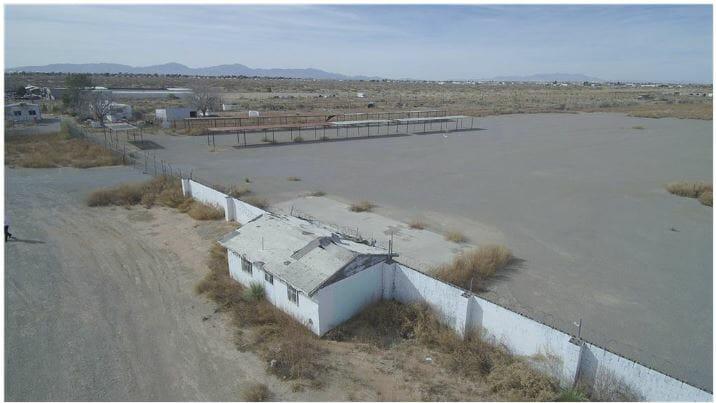
Additional Photos
Listing Agents

Juan Uribe
O: 915-585-0007
juan@teamuribe.com
O: 915-585-0007
juan@teamuribe.com
While we strive to provide the most accurate information, all listing information, and demographic data, is provided by third-parties. As such, MyEListing will not be responsible for the accuracy of the information. It is strongly recommended that you verify all information with the listing agent, and any relevant agencies, prior to making any decisions.


