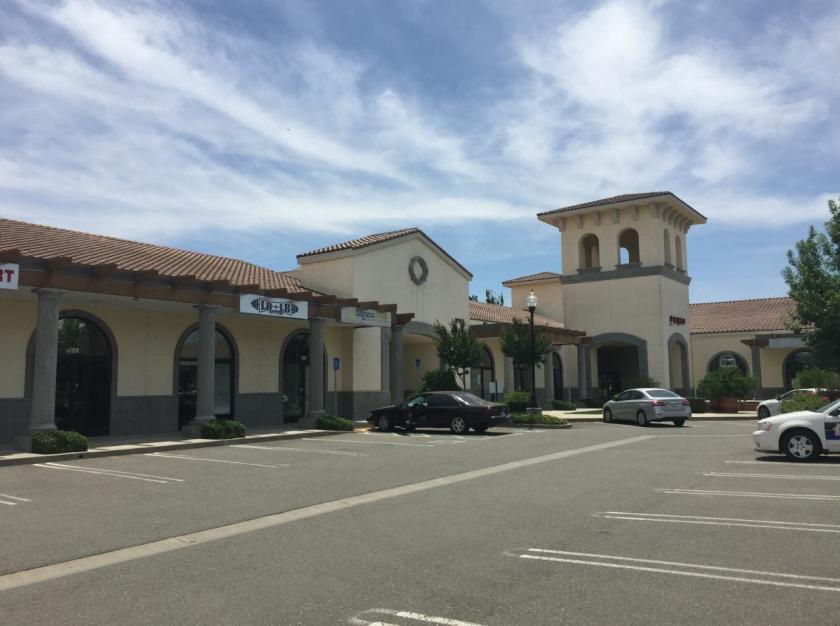
Retail Space
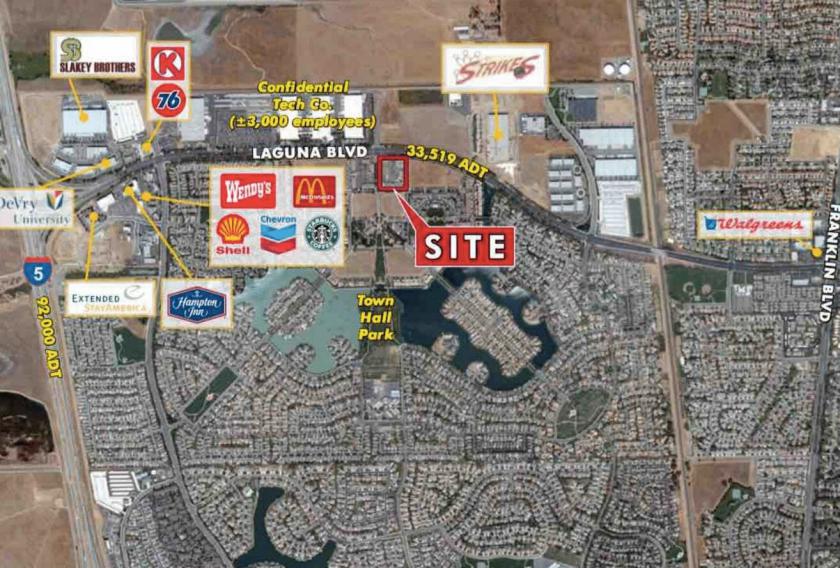
9101 Laguna Main Street Elk Grove, CA 95758
9101 Laguna Main Street Elk Grove, CA 95758
Details & Description
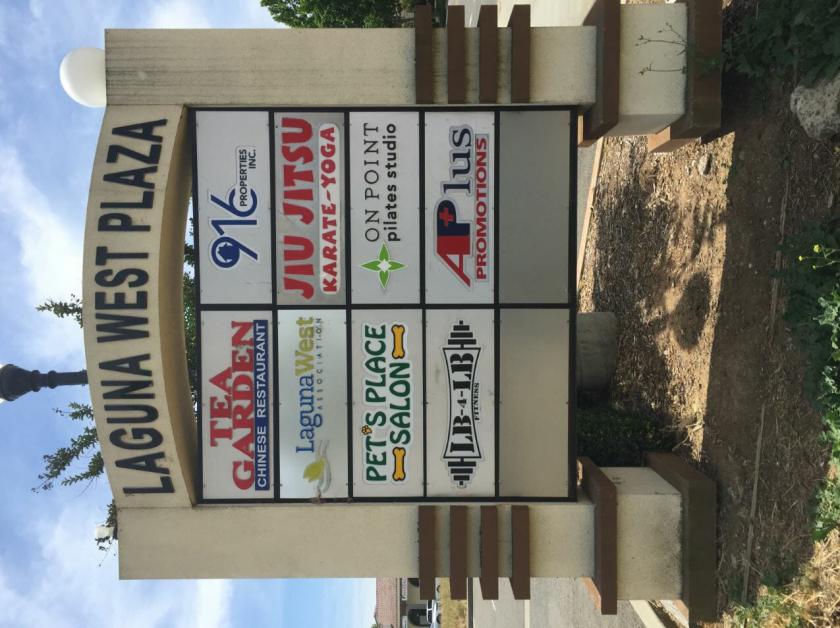
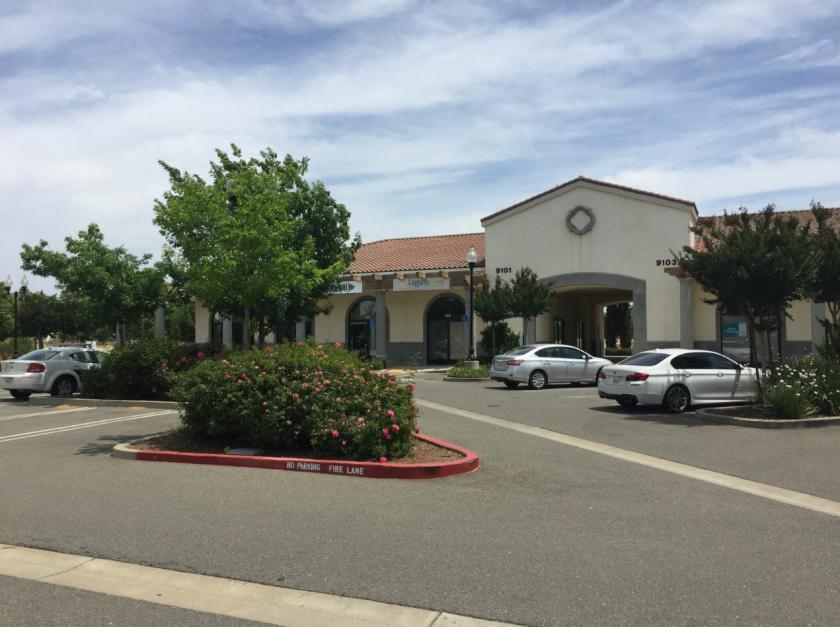
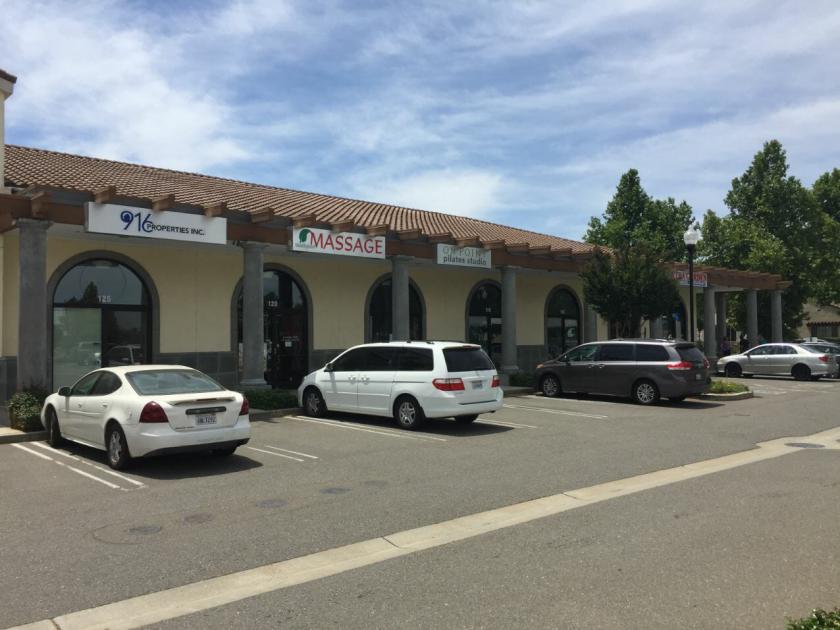
Additional Photos
Listing Agents

Nate Giwoff
O: 916-524-6097
nate@gqnorth.com
O: 916-524-6097
nate@gqnorth.com
While we strive to provide the most accurate information, all listing information, and demographic data, is provided by third-parties. As such, MyEListing will not be responsible for the accuracy of the information. It is strongly recommended that you verify all information with the listing agent, and any relevant agencies, prior to making any decisions.


