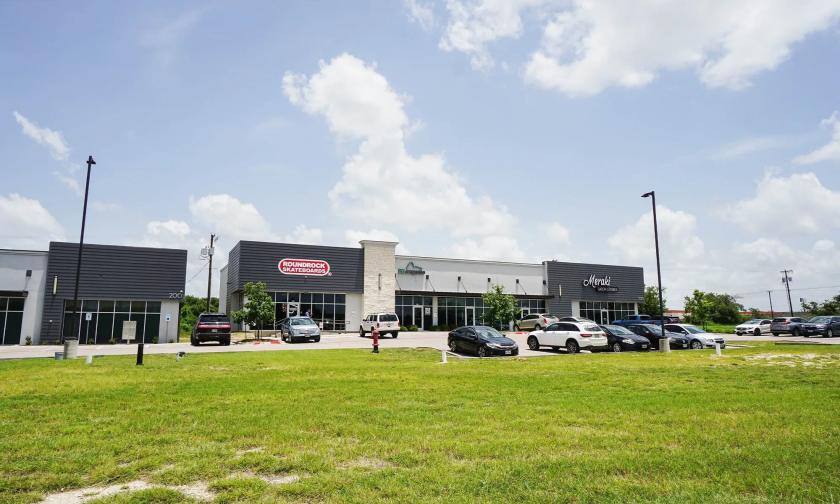
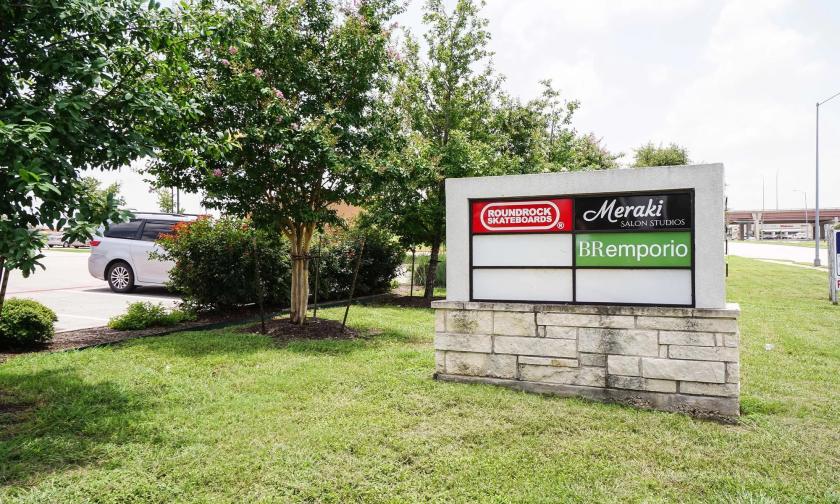
Retail Space
2471 South A.W. Grimes Boulevard Round Rock, TX 78664
2471 South A.W. Grimes Boulevard Round Rock, TX 78664
Details & Description
Property Highlights
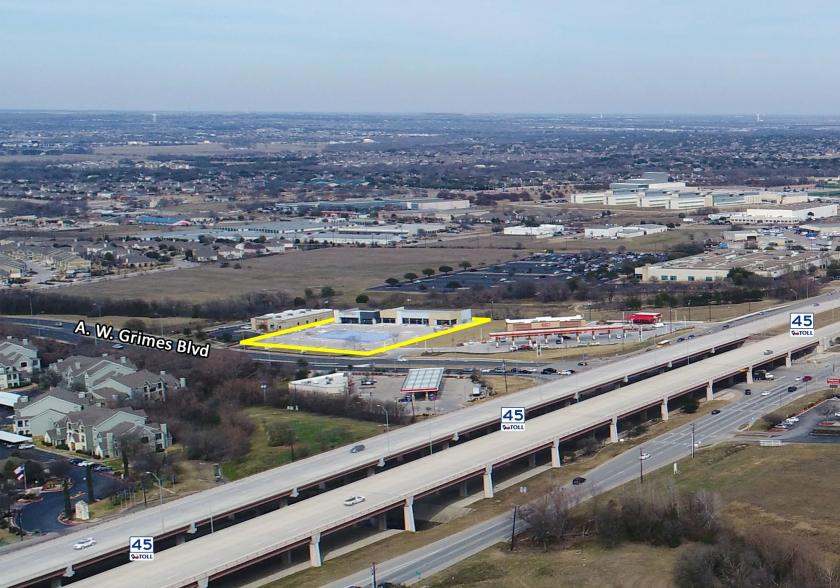
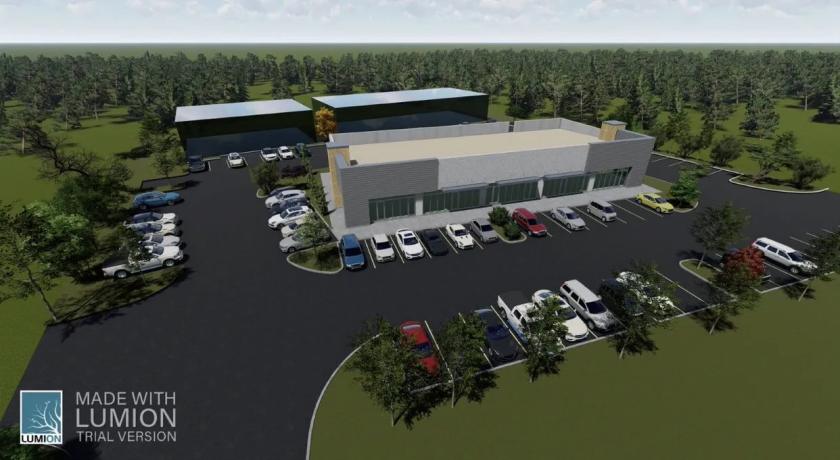
• 20,300 SQ FT building near the corner of SH45 and AW Grimes.
• Neighborhood Retail, Office or Special Use.
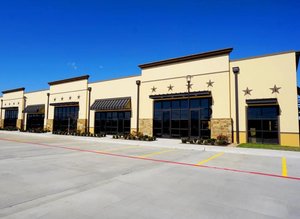
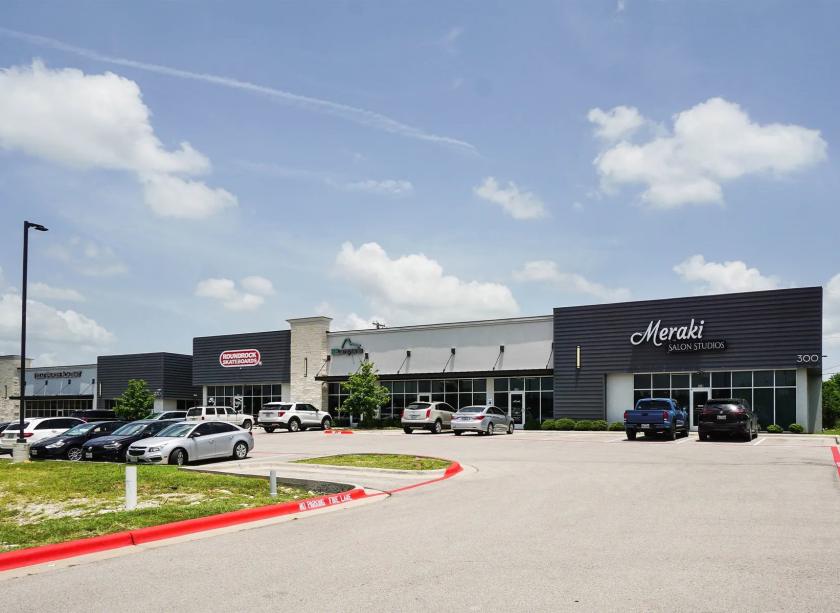
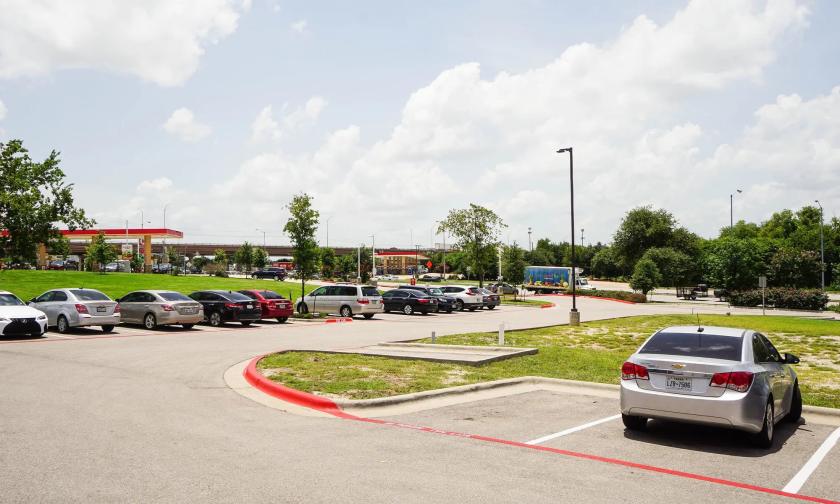
Additional Photos
Listing Agents

Robert Shore
O: 512-814-1812
robert@donquick.com
O: 512-814-1812
robert@donquick.com

Brent Campbell
O: 512-814-1814
brent@donquick.com
O: 512-814-1814
brent@donquick.com
While we strive to provide the most accurate information, all listing information, and demographic data, is provided by third-parties. As such, MyEListing will not be responsible for the accuracy of the information. It is strongly recommended that you verify all information with the listing agent, and any relevant agencies, prior to making any decisions.