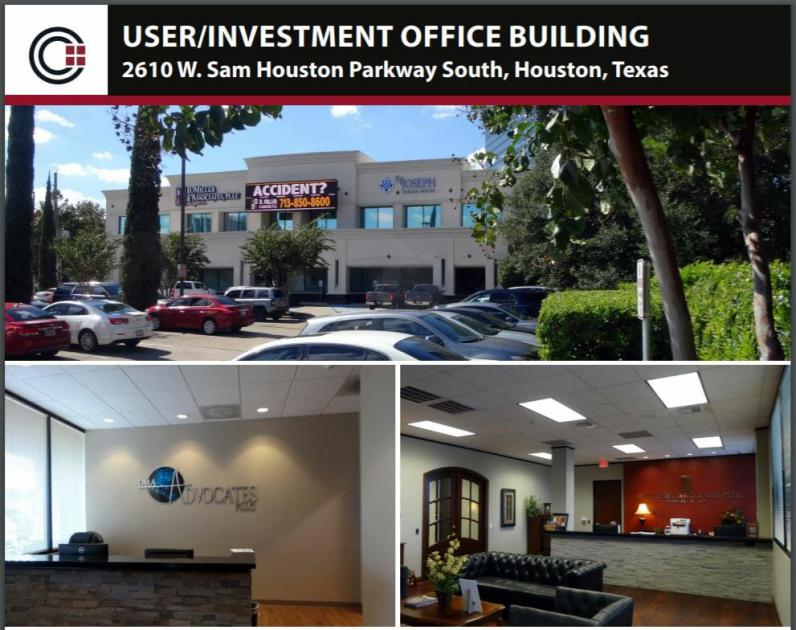
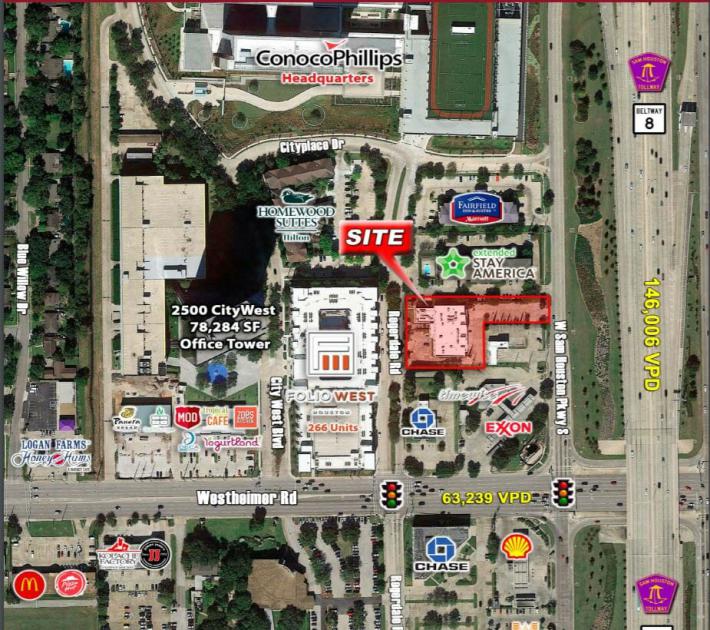
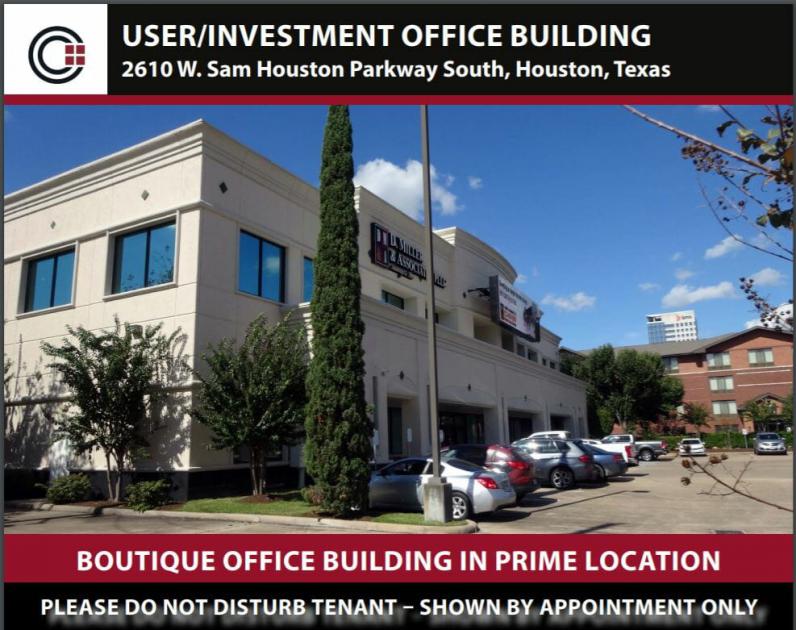
1-Mile | 3-Miles | 5-Miles | ||
---|---|---|---|---|
Total Population | 22,325 | 188,976 | 552,440 | |
Population Median Age | 33 | 35 | 34 | |
Population by Age | 0-9 Yrs | 3232 (14%) | 26580 (14%) | 85909 (15%) |
10-19 Yrs | 2416 (10%) | 22982 (12%) | 70433 (12%) | |
20-29 Yrs | 4661 (20%) | 31743 (16%) | 92776 (16%) | |
30-39 Yrs | 4341 (19%) | 32582 (17%) | 93450 (16%) | |
40-49 Yrs | 2870 (12%) | 25806 (13%) | 74495 (13%) | |
50-59 Yrs | 2418 (10%) | 20110 (10%) | 58717 (10%) | |
60-69 Yrs | 1368 (6%) | 15538 (8%) | 41532 (7%) | |
70+ Yrs | 1018 (4%) | 13634 (7%) | 35128 (6%) | |
Median HH Income | $45,523 | $48,615 | $47,576 | |
Total Household Income | < 24K | 2400 (24%) | 19667 (25%) | 54357 (25%) |
25-49K | 3082 (30%) | 20132 (25%) | 55006 (26%) | |
50-74K | 1515 (15%) | 11635 (14%) | 33392 (15%) | |
75-99K | 992 (9%) | 7171 (9%) | 19211 (9%) | |
100-199K | 1426 (14%) | 11313 (14%) | 30535 (14%) | |
200K+ | 553 (5%) | 7931 (10%) | 18175 (8%) | |
Highest Education Level | No Diploma | 1893 | 20637 | 73287 |
Diploma or GED | 2475 | 21463 | 71829 | |
Some College | 3413 | 23009 | 62462 | |
Assoc. Degree | 895 | 7153 | 18769 | |
Bachelors Degree | 4058 | 34088 | 81668 | |
Higher Degree | 2060 | 20013 | 48064 | |
Total Housing Units | 11,240 | 87,599 | 237,875 | |
--Owner-Occupied | 2,232 | 26,294 | 70,613 | |
--Renter-Occupied | 7,735 | 51,554 | 140,062 | |
Owner-Occupied Values | < 100K | 339 | 3849 | 12546 |
100-199K | 363 | 6101 | 21529 | |
200-299K | 399 | 4096 | 9642 | |
300-399K | 511 | 3535 | 6955 | |
400-499K | 318 | 1523 | 3487 | |
500K+ | 302 | 7190 | 16454 | |
Total Working Age Population | 17,910 | 147,793 | 421,839 | |
In Work Force | 12,858 | 102,527 | 294,119 | |
Not In Work Force | 5,052 | 45,265 | 127,720 | |
Workforce Employed | 12,209 | 96,707 | 276,972 | |
Workforce Unemployed | 635 | 5,800 | 17,039 | |
Civlian Workforce | 12,844 | 102,506 | 294,012 | |
Military Workforce | 14 | 21 | 107 | |
Total Households | 9,968 | 77,848 | 210,675 | |
Family Households | 5,256 | 45,395 | 128,227 | |
Non-Family Households | 4,712 | 32,453 | 82,448 | |
Married Couple | 3,348 | 29,974 | 83,349 | |
Other Family | 1,908 | 15,421 | 44,878 | |
Married w/Child | 1,568 | 13,445 | 41,158 | |
Single Male w/Child | 122 | 1,500 | 5,219 | |
Single Female w/Child | 958 | 7,246 | 20,694 |
Population Change Last Two Decades - Plus Projection
2000 | % | 2010 | % | 2020 | % | 2030 | |
---|---|---|---|---|---|---|---|
Texas | 20,851,820 | +21 | 25,145,561 | +18 | 29,677,668 | +18 | 34,894,452 |
Harris County | 3,400,578 | +20 | 4,092,459 | +22 | 4,978,845 | +19 | 5,924,750 |
Total Working Age Population:
Total Households:
Total Working Age Population:
Total Households:
Total Working Age Population:
Total Households: