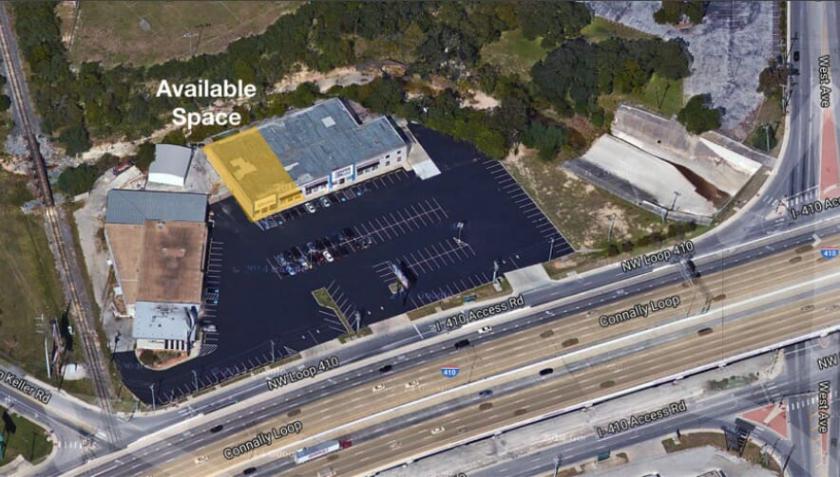
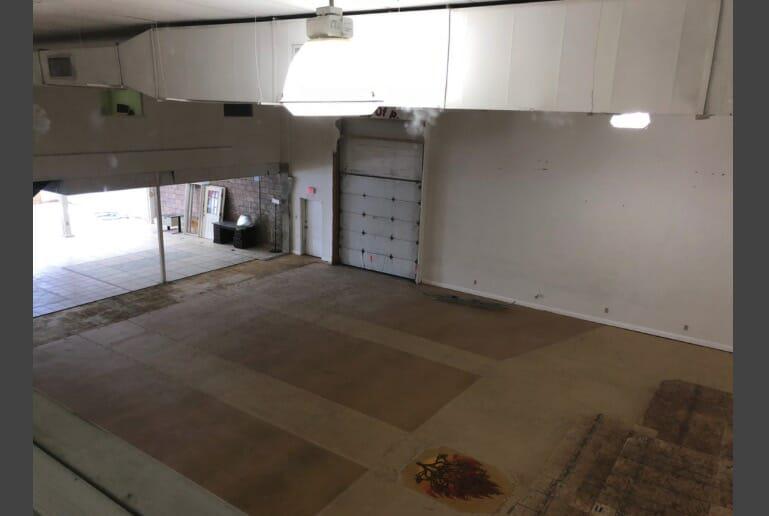
1-Mile | 3-Miles | 5-Miles | ||
---|---|---|---|---|
Total Population | 12,281 | 140,900 | 352,390 | |
Population Median Age | 38 | 36 | 37 | |
Population by Age | 0-9 Yrs | 1490 (12%) | 19000 (13%) | 44682 (12%) |
10-19 Yrs | 1705 (13%) | 16044 (11%) | 41513 (11%) | |
20-29 Yrs | 1730 (14%) | 26972 (19%) | 63719 (18%) | |
30-39 Yrs | 1837 (14%) | 22215 (15%) | 53462 (15%) | |
40-49 Yrs | 1321 (10%) | 15428 (10%) | 40824 (11%) | |
50-59 Yrs | 1659 (13%) | 16574 (11%) | 41535 (11%) | |
60-69 Yrs | 1263 (10%) | 12376 (8%) | 33368 (9%) | |
70+ Yrs | 1275 (10%) | 12290 (8%) | 33287 (9%) | |
Median HH Income | $52,617 | $43,194 | $49,823 | |
Total Household Income | < 24K | 936 (22%) | 14789 (27%) | 33255 (24%) |
25-49K | 1049 (25%) | 15607 (28%) | 35444 (25%) | |
50-74K | 850 (20%) | 10602 (19%) | 25563 (18%) | |
75-99K | 427 (10%) | 5804 (10%) | 15095 (11%) | |
100-199K | 709 (16%) | 6286 (11%) | 20408 (14%) | |
200K+ | 218 (5%) | 1451 (2%) | 7241 (5%) | |
Highest Education Level | No Diploma | 1679 | 15657 | 32408 |
Diploma or GED | 1643 | 23922 | 53260 | |
Some College | 1819 | 21829 | 52196 | |
Assoc. Degree | 470 | 6435 | 16863 | |
Bachelors Degree | 1480 | 16412 | 50787 | |
Higher Degree | 1022 | 9204 | 32416 | |
Total Housing Units | 4,571 | 60,985 | 152,412 | |
--Owner-Occupied | 2,651 | 22,199 | 59,406 | |
--Renter-Occupied | 1,538 | 32,340 | 77,601 | |
Owner-Occupied Values | < 100K | 683 | 6039 | 13168 |
100-199K | 953 | 9759 | 22033 | |
200-299K | 590 | 3505 | 11388 | |
300-399K | 241 | 1613 | 5690 | |
400-499K | 107 | 560 | 2201 | |
500K+ | 78 | 723 | 4925 | |
Total Working Age Population | 9,696 | 112,467 | 283,939 | |
In Work Force | 5,992 | 73,599 | 185,115 | |
Not In Work Force | 3,704 | 38,868 | 98,824 | |
Workforce Employed | 5,508 | 69,641 | 174,938 | |
Workforce Unemployed | 467 | 3,698 | 9,245 | |
Civlian Workforce | 5,975 | 73,339 | 184,183 | |
Military Workforce | 17 | 259 | 932 | |
Total Households | 4,189 | 54,538 | 137,007 | |
Family Households | 2,815 | 29,096 | 74,958 | |
Non-Family Households | 1,374 | 25,442 | 62,049 | |
Married Couple | 1,999 | 18,886 | 50,152 | |
Other Family | 816 | 10,210 | 24,806 | |
Married w/Child | 714 | 7,420 | 19,313 | |
Single Male w/Child | 54 | 1,110 | 2,213 | |
Single Female w/Child | 299 | 4,027 | 10,353 |
Population Change Last Two Decades - Plus Projection
2000 | % | 2010 | % | 2020 | % | 2030 | |
---|---|---|---|---|---|---|---|
Texas | 20,851,820 | +21 | 25,145,561 | +18 | 29,677,668 | +18 | 34,894,452 |
Bexar County | 1,392,931 | +23 | 1,714,773 | +22 | 2,093,502 | +20 | 2,502,617 |
Total Working Age Population:
Total Households:
Total Working Age Population:
Total Households:
Total Working Age Population:
Total Households: