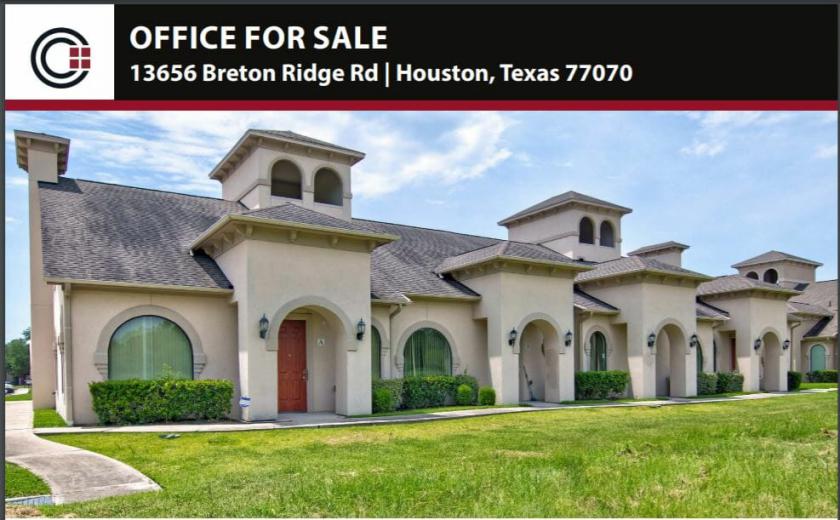
Office Space
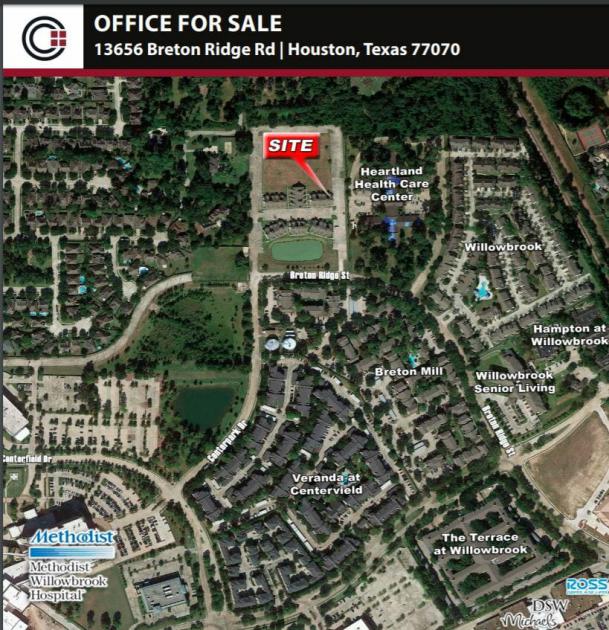
13656 Breton Ridge Street Houston, TX 77070
13656 Breton Ridge Street Houston, TX 77070
Details & Description
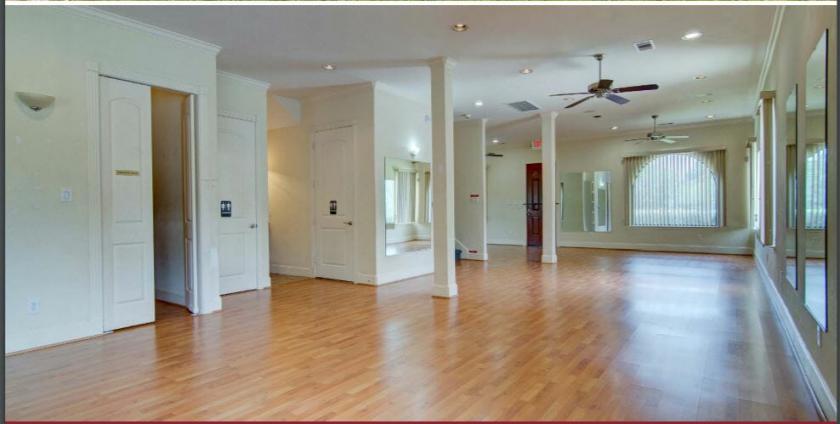
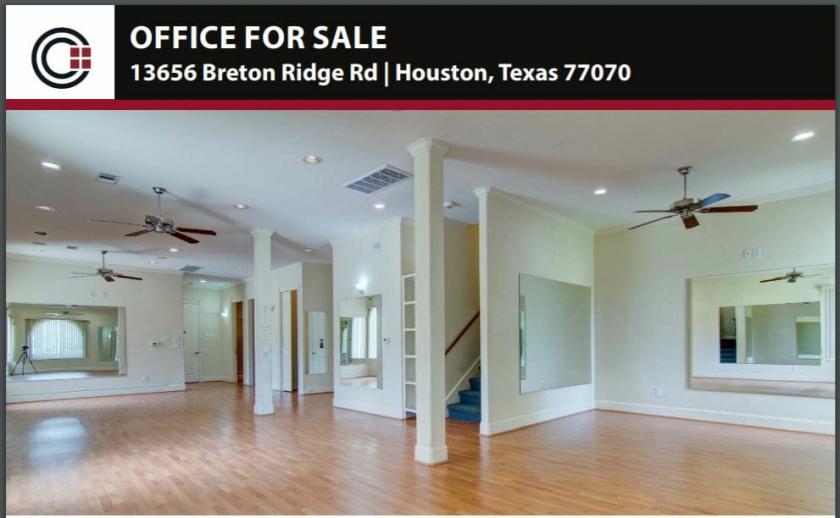
Additional Photos
Listing Agents

Blake Virgilio
O: 713-744-7465
M: 281-433-9505
bvirgilio@caldwellcos.com
O: 713-744-7465
M: 281-433-9505
bvirgilio@caldwellcos.com
While we strive to provide the most accurate information, all listing information, and demographic data, is provided by third-parties. As such, MyEListing will not be responsible for the accuracy of the information. It is strongly recommended that you verify all information with the listing agent, and any relevant agencies, prior to making any decisions.


