Retail Space
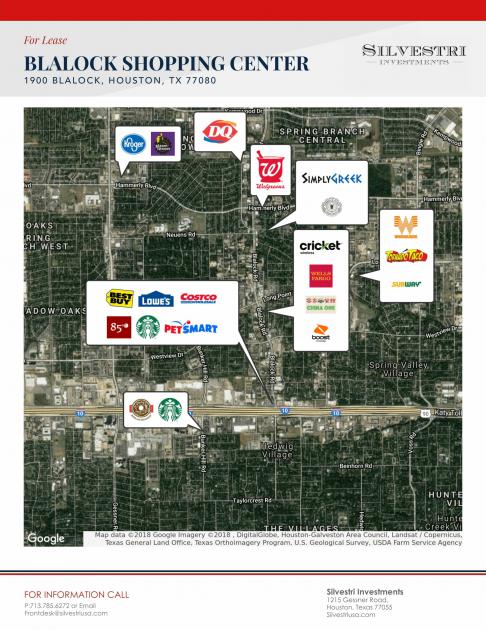
1900 Blalock Unit N Houston, TX 77080
1900 Blalock Unit N Houston, TX 77080
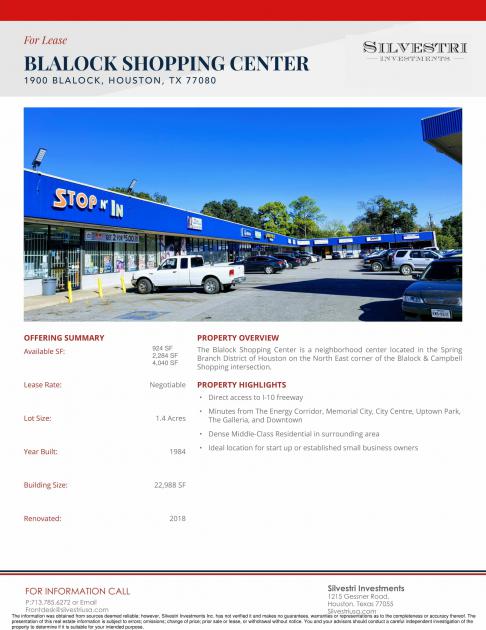
Details & Description
Additional Photos
Listing Agents

Victor Garbarino
O: 713-785-6272
victor@silvestriusa.com
O: 713-785-6272
victor@silvestriusa.com
While we strive to provide the most accurate information, all listing information, and demographic data, is provided by third-parties. As such, MyEListing will not be responsible for the accuracy of the information. It is strongly recommended that you verify all information with the listing agent, and any relevant agencies, prior to making any decisions.


