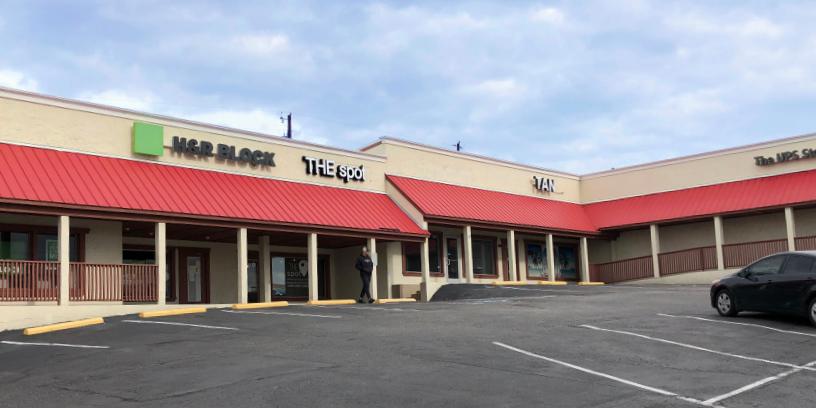
Retail Space
1101-1123 FM 1431 Marble Falls, TX 78654
1101-1123 FM 1431 Marble Falls, TX 78654
Details & Description
Property Highlights
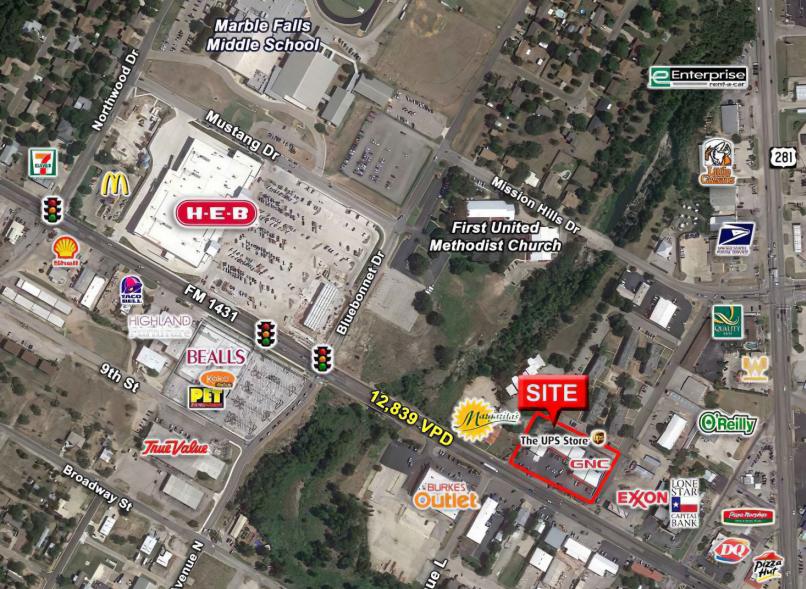
- • Frontage: 312 FT on FM 1431
- • Access: Hard Corner
- • Traffic Count: 15,422 VPD (TXDOT 2019)
- • A Quarter mile to HEB
- • Located on a major thoroughfare
Listing Agents

Mollie McClean
Gold Tier Real Estate
O: 720-217-1352
mollie@goldtier.net
Gold Tier Real Estate
O: 720-217-1352
mollie@goldtier.net
While we strive to provide the most accurate information, all listing information, and demographic data, is provided by third-parties. As such, MyEListing will not be responsible for the accuracy of the information. It is strongly recommended that you verify all information with the listing agent, and any relevant agencies, prior to making any decisions.