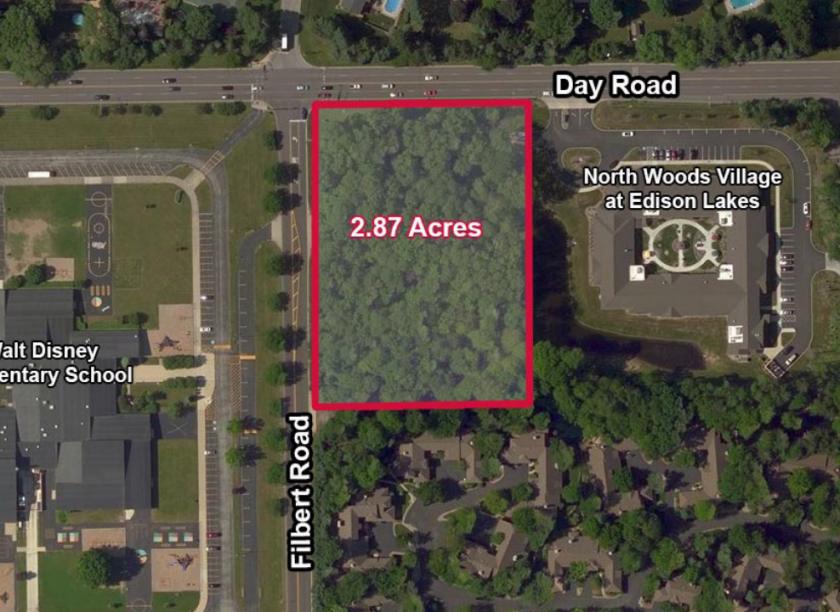
1-Mile | 3-Miles | 5-Miles | ||
---|---|---|---|---|
Total Population | 4,237 | 52,667 | 148,677 | |
Population Median Age | 37 | 38 | 37 | |
Population by Age | 0-9 Yrs | 627 (14%) | 6637 (12%) | 17783 (11%) |
10-19 Yrs | 458 (10%) | 6002 (11%) | 22247 (14%) | |
20-29 Yrs | 845 (19%) | 9340 (17%) | 24937 (16%) | |
30-39 Yrs | 524 (12%) | 6881 (13%) | 18591 (12%) | |
40-49 Yrs | 419 (9%) | 6285 (11%) | 16742 (11%) | |
50-59 Yrs | 315 (7%) | 5391 (10%) | 16465 (11%) | |
60-69 Yrs | 669 (15%) | 6564 (12%) | 17448 (11%) | |
70+ Yrs | 379 (8%) | 5567 (10%) | 14464 (9%) | |
Median HH Income | $46,524 | $46,288 | $55,964 | |
Total Household Income | < 24K | 482 (25%) | 5752 (24%) | 12188 (21%) |
25-49K | 521 (27%) | 6714 (28%) | 13818 (23%) | |
50-74K | 319 (16%) | 4561 (19%) | 11018 (19%) | |
75-99K | 222 (11%) | 2555 (11%) | 7095 (12%) | |
100-199K | 254 (13%) | 2870 (12%) | 10442 (18%) | |
200K+ | 93 (4%) | 701 (3%) | 3125 (5%) | |
Highest Education Level | No Diploma | 313 | 3821 | 8155 |
Diploma or GED | 644 | 9875 | 25239 | |
Some College | 525 | 7369 | 19272 | |
Assoc. Degree | 221 | 2621 | 7506 | |
Bachelors Degree | 748 | 7143 | 19259 | |
Higher Degree | 481 | 4847 | 15099 | |
Total Housing Units | 2,053 | 26,562 | 65,108 | |
--Owner-Occupied | 736 | 12,071 | 36,460 | |
--Renter-Occupied | 1,156 | 11,083 | 21,225 | |
Owner-Occupied Values | < 100K | 98 | 4518 | 11355 |
100-199K | 284 | 4852 | 14548 | |
200-299K | 231 | 1676 | 6248 | |
300-399K | 70 | 511 | 2061 | |
400-499K | 0 | 101 | 695 | |
500K+ | 53 | 413 | 1553 | |
Total Working Age Population | 3,375 | 42,482 | 119,623 | |
In Work Force | 2,110 | 27,989 | 76,574 | |
Not In Work Force | 1,264 | 14,494 | 43,049 | |
Workforce Employed | 2,037 | 26,207 | 72,593 | |
Workforce Unemployed | 45 | 1,725 | 3,855 | |
Civlian Workforce | 2,082 | 27,932 | 76,448 | |
Military Workforce | 28 | 57 | 126 | |
Total Households | 1,892 | 23,154 | 57,685 | |
Family Households | 1,100 | 11,937 | 33,629 | |
Non-Family Households | 792 | 11,217 | 24,056 | |
Married Couple | 762 | 8,200 | 24,649 | |
Other Family | 338 | 3,737 | 8,981 | |
Married w/Child | 250 | 3,033 | 9,666 | |
Single Male w/Child | 8 | 511 | 1,293 | |
Single Female w/Child | 146 | 1,464 | 3,820 |
Population Change Last Two Decades - Plus Projection
2000 | % | 2010 | % | 2020 | % | 2030 | |
---|---|---|---|---|---|---|---|
Indiana | 6,080,485 | +7 | 6,483,802 | +4 | 6,738,573 | +4 | 7,014,880 |
St. Joseph County | 265,559 | +1 | 266,931 | +1 | 269,113 | +1 | 271,912 |
Michigan | 9,938,444 | -1 | 9,883,640 | +1 | 10,023,423 | +4 | 10,424,510 |
Cass County | 51,104 | +2 | 52,293 | -2 | 51,383 | +3 | 53,143 |
Total Working Age Population:
Total Households:
Total Working Age Population:
Total Households:
Total Working Age Population:
Total Households: