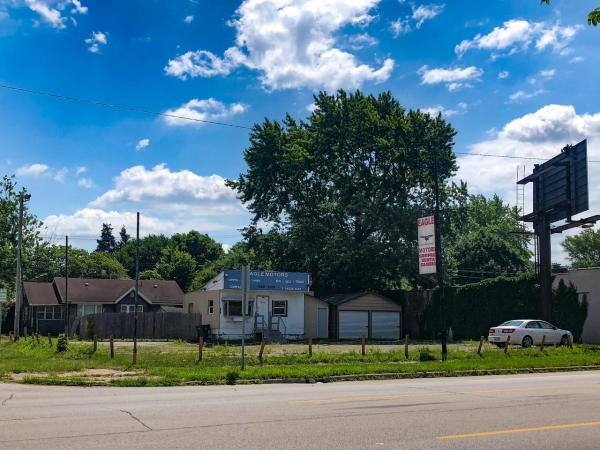
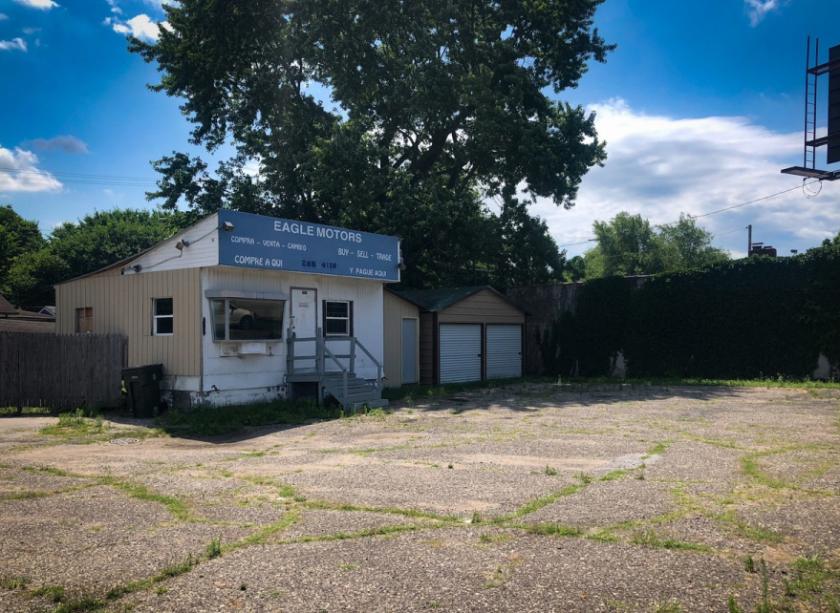
1-Mile | 3-Miles | 5-Miles | ||
---|---|---|---|---|
Total Population | 10,044 | 72,492 | 152,085 | |
Population Median Age | 35 | 36 | 36 | |
Population by Age | 0-9 Yrs | 1607 (15%) | 9982 (13%) | 19680 (12%) |
10-19 Yrs | 1440 (14%) | 11133 (15%) | 23890 (15%) | |
20-29 Yrs | 1272 (12%) | 10442 (14%) | 26832 (17%) | |
30-39 Yrs | 1402 (13%) | 10328 (14%) | 19434 (12%) | |
40-49 Yrs | 1445 (14%) | 8498 (11%) | 16556 (10%) | |
50-59 Yrs | 1308 (13%) | 7781 (10%) | 15642 (10%) | |
60-69 Yrs | 914 (9%) | 8300 (11%) | 16537 (10%) | |
70+ Yrs | 658 (6%) | 6026 (8%) | 13514 (8%) | |
Median HH Income | $44,377 | $44,535 | $43,240 | |
Total Household Income | < 24K | 1056 (26%) | 7619 (27%) | 16661 (28%) |
25-49K | 1143 (29%) | 7623 (27%) | 16307 (28%) | |
50-74K | 748 (19%) | 5527 (19%) | 11327 (19%) | |
75-99K | 455 (11%) | 2817 (10%) | 5593 (9%) | |
100-199K | 486 (12%) | 3438 (12%) | 6598 (11%) | |
200K+ | 45 (1%) | 843 (3%) | 1348 (2%) | |
Highest Education Level | No Diploma | 910 | 5851 | 12559 |
Diploma or GED | 2069 | 13595 | 29495 | |
Some College | 1420 | 9831 | 19515 | |
Assoc. Degree | 617 | 4110 | 7506 | |
Bachelors Degree | 982 | 7221 | 14165 | |
Higher Degree | 383 | 5666 | 10581 | |
Total Housing Units | 4,628 | 32,245 | 67,433 | |
--Owner-Occupied | 2,526 | 16,379 | 33,003 | |
--Renter-Occupied | 1,406 | 11,489 | 24,831 | |
Owner-Occupied Values | < 100K | 1834 | 9172 | 18068 |
100-199K | 616 | 5188 | 10848 | |
200-299K | 24 | 926 | 2118 | |
300-399K | 37 | 568 | 1007 | |
400-499K | 9 | 141 | 264 | |
500K+ | 5 | 384 | 698 | |
Total Working Age Population | 7,504 | 55,607 | 119,640 | |
In Work Force | 4,725 | 35,348 | 74,671 | |
Not In Work Force | 2,779 | 20,259 | 44,970 | |
Workforce Employed | 4,483 | 33,066 | 69,893 | |
Workforce Unemployed | 242 | 2,270 | 4,688 | |
Civlian Workforce | 4,725 | 35,336 | 74,582 | |
Military Workforce | 0 | 12 | 89 | |
Total Households | 3,933 | 27,868 | 57,834 | |
Family Households | 2,127 | 15,370 | 31,502 | |
Non-Family Households | 1,806 | 12,498 | 26,332 | |
Married Couple | 1,045 | 9,369 | 19,541 | |
Other Family | 1,081 | 6,001 | 11,961 | |
Married w/Child | 391 | 3,803 | 7,676 | |
Single Male w/Child | 201 | 673 | 1,363 | |
Single Female w/Child | 464 | 2,895 | 5,582 |
Population Change Last Two Decades - Plus Projection
2000 | % | 2010 | % | 2020 | % | 2030 | |
---|---|---|---|---|---|---|---|
Indiana | 6,080,485 | +7 | 6,483,802 | +4 | 6,738,573 | +4 | 7,014,880 |
St. Joseph County | 265,559 | +1 | 266,931 | +1 | 269,113 | +1 | 271,912 |
Total Working Age Population:
Total Households:
Total Working Age Population:
Total Households:
Total Working Age Population:
Total Households: