Commercial Land
VL Adjacent to 23761 Western Avenue South Bend, IN 46619
VL Adjacent to 23761 Western Avenue South Bend, IN 46619
Details & Description
Property Highlights
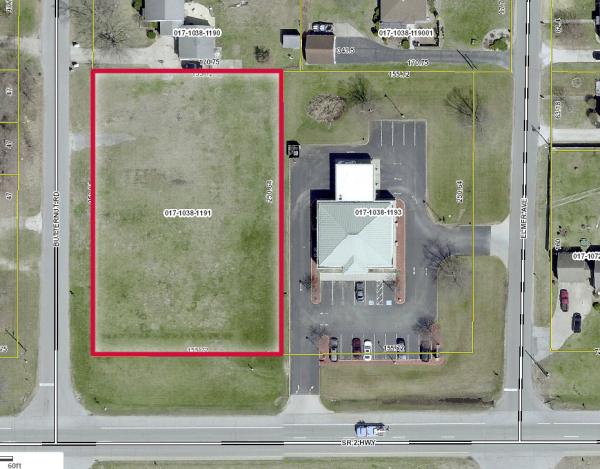
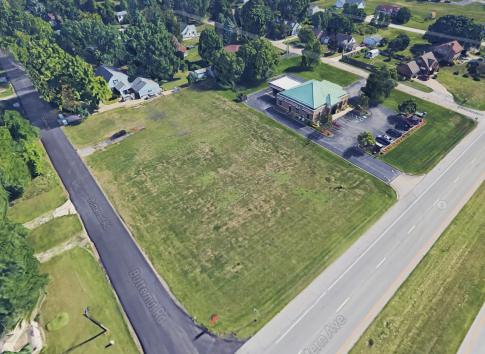
- • Vacant Land near Northwest Bank Branch
- • Corner of Western Avenue and Elmer Avenue
- • Ready to Develop on a high traffic corridor.
Listing Agents

Richard Doolittle
O: 574-271-4060
M: 574-485-1535
rdoolittle@cressy.com
O: 574-271-4060
M: 574-485-1535
rdoolittle@cressy.com

Sheral Litell
O: 574-271-4060
M: 574-485-1527
slitell@cressy.com
O: 574-271-4060
M: 574-485-1527
slitell@cressy.com
While we strive to provide the most accurate information, all listing information, and demographic data, is provided by third-parties. As such, MyEListing will not be responsible for the accuracy of the information. It is strongly recommended that you verify all information with the listing agent, and any relevant agencies, prior to making any decisions.