Retail Space
23761 West Western Avenue South Bend, IN 46619
23761 West Western Avenue South Bend, IN 46619
Details & Description
Property Highlights
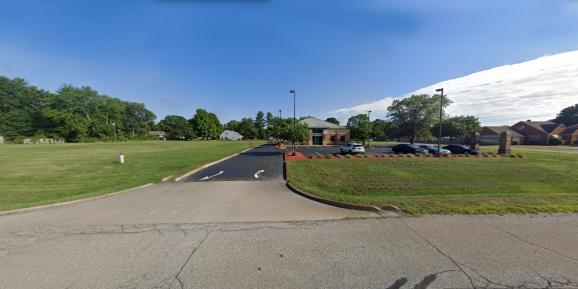
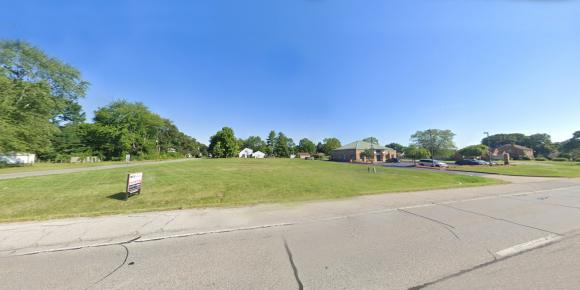
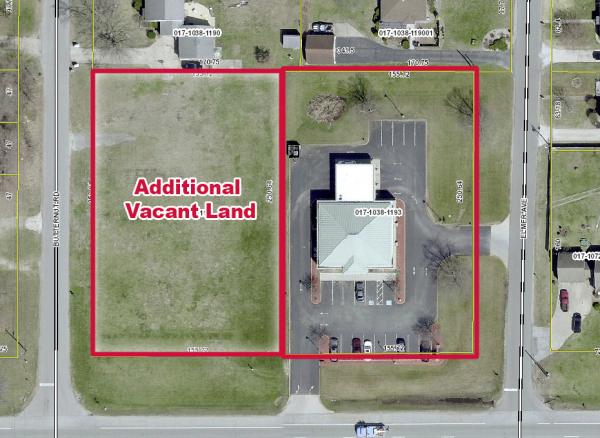
• Adaptable Former Bank Branch with additional land for Sale for larger development.
• Easy Access to US 31, SR 20 East and West.
Listing Agents

Sheral Litell
O: 574-271-4060
M: 574-485-1527
slitell@cressy.com
O: 574-271-4060
M: 574-485-1527
slitell@cressy.com
While we strive to provide the most accurate information, all listing information, and demographic data, is provided by third-parties. As such, MyEListing will not be responsible for the accuracy of the information. It is strongly recommended that you verify all information with the listing agent, and any relevant agencies, prior to making any decisions.