Industrial Properties
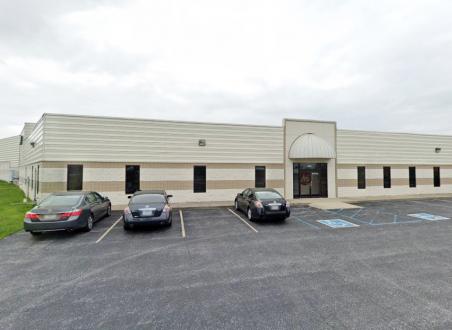
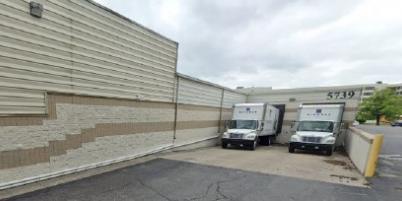
5739 Professional Circle Indianapolis, IN 46241
5739 Professional Circle Indianapolis, IN 46241
Details & Description
Property Highlights
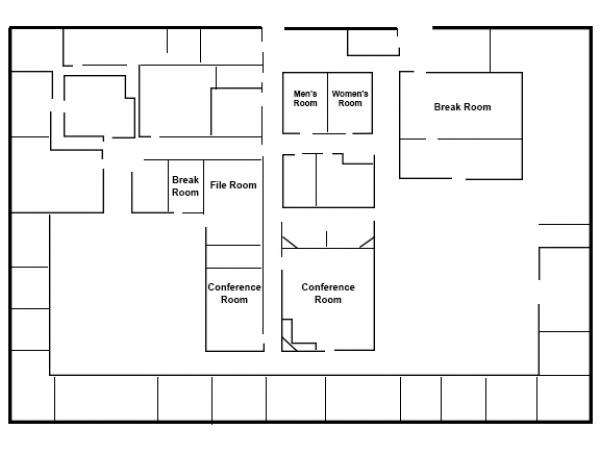
- • Suite 5739
- • Easy access to I-465 & I-70
- • Heavy electrical service
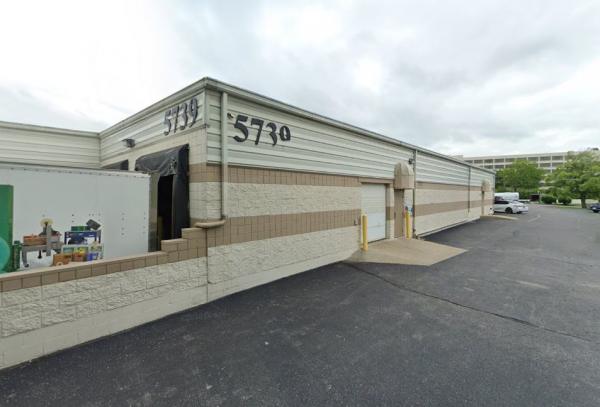
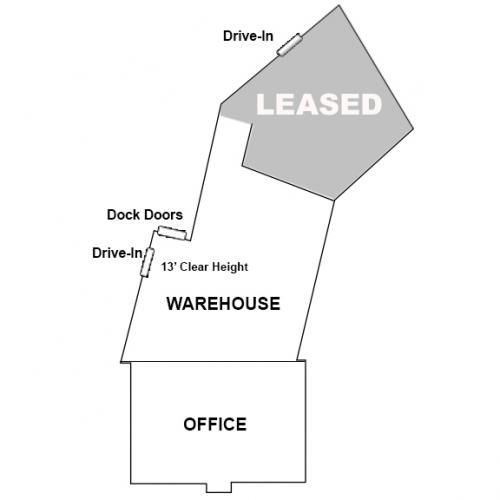
- • Two docks with levelers
- • 100% air conditioned
- • Clearance 14' - 19'
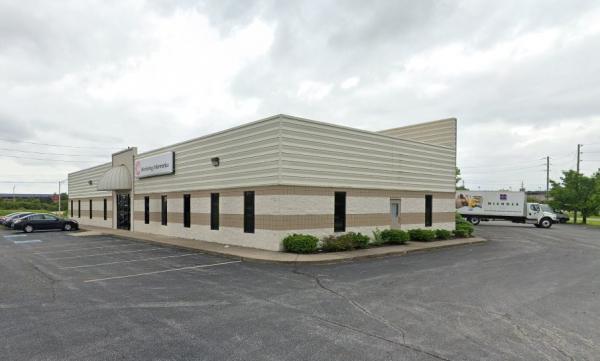
Additional Photos
Listing Agents

Andrew Follman
O: 317-566-5614
M: 317-294-3576
afollman@cressy.com
O: 317-566-5614
M: 317-294-3576
afollman@cressy.com
While we strive to provide the most accurate information, all listing information, and demographic data, is provided by third-parties. As such, MyEListing will not be responsible for the accuracy of the information. It is strongly recommended that you verify all information with the listing agent, and any relevant agencies, prior to making any decisions.