Industrial Properties
1320 1402 and 1524 S Merrifield Ave Mishawaka, IN 46544
1320 1402 and 1524 S Merrifield Ave Mishawaka, IN 46544
Details & Description
Property Highlights
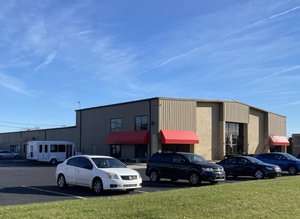
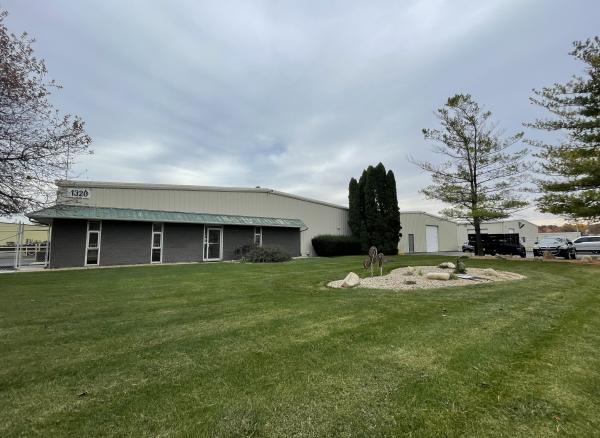
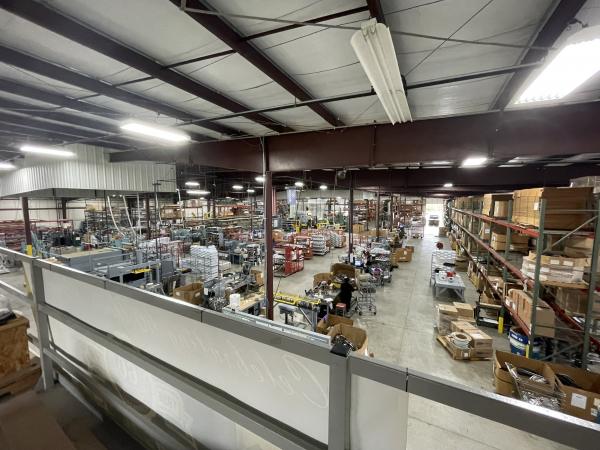
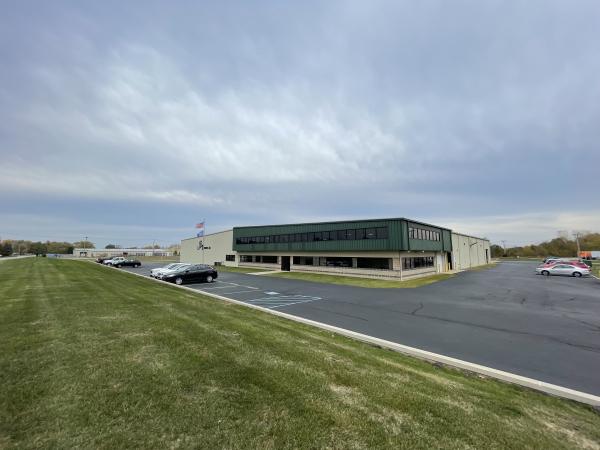
• Building #1- 49,200 SF, built in 2001 , 3 docks and 7 Overhead doors
• Building #2- 28,500 SF, built in 1975 , 1 docks and 5 Overhead doors
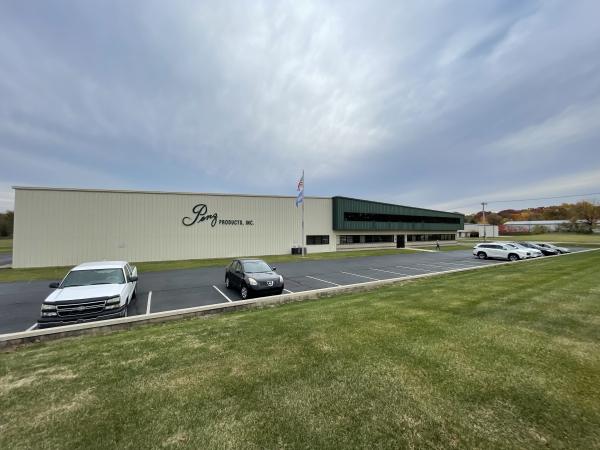
Additional Photos
Listing Agents

Christian Davey
O: 574-271-4060
M: 574-485-1534
cjdavey@cressy.com
O: 574-271-4060
M: 574-485-1534
cjdavey@cressy.com

Noah Davey
O: 574-271-4060
M: 574-485-1530
ndavey@cressy.com
O: 574-271-4060
M: 574-485-1530
ndavey@cressy.com

Blair Wozny
O: 574-485-1517
bwozny@cressy.com
O: 574-485-1517
bwozny@cressy.com
While we strive to provide the most accurate information, all listing information, and demographic data, is provided by third-parties. As such, MyEListing will not be responsible for the accuracy of the information. It is strongly recommended that you verify all information with the listing agent, and any relevant agencies, prior to making any decisions.