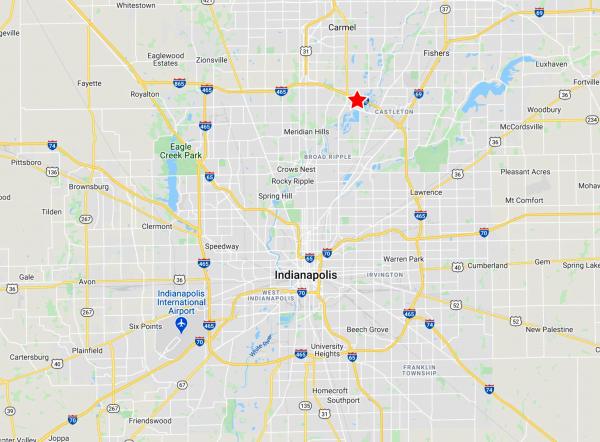
1-Mile | 3-Miles | 5-Miles | ||
---|---|---|---|---|
Total Population | 4,920 | 57,651 | 181,370 | |
Population Median Age | 41 | 41 | 40 | |
Population by Age | 0-9 Yrs | 197 (4%) | 4956 (8%) | 19585 (10%) |
10-19 Yrs | 411 (8%) | 6228 (10%) | 19967 (11%) | |
20-29 Yrs | 1399 (28%) | 8960 (15%) | 27803 (15%) | |
30-39 Yrs | 658 (13%) | 8259 (14%) | 28169 (15%) | |
40-49 Yrs | 580 (11%) | 7151 (12%) | 21731 (11%) | |
50-59 Yrs | 556 (11%) | 7571 (13%) | 22519 (12%) | |
60-69 Yrs | 561 (11%) | 6965 (12%) | 21043 (11%) | |
70+ Yrs | 558 (11%) | 7563 (13%) | 20552 (11%) | |
Median HH Income | $58,469 | $70,274 | $70,475 | |
Total Household Income | < 24K | 391 (15%) | 3641 (13%) | 11209 (13%) |
25-49K | 729 (28%) | 6048 (22%) | 16654 (20%) | |
50-74K | 346 (13%) | 4685 (17%) | 15194 (18%) | |
75-99K | 212 (8%) | 3085 (11%) | 9825 (12%) | |
100-199K | 671 (25%) | 6893 (25%) | 19184 (23%) | |
200K+ | 236 (9%) | 2713 (10%) | 8893 (10%) | |
Highest Education Level | No Diploma | 27 | 1468 | 4335 |
Diploma or GED | 447 | 5974 | 18021 | |
Some College | 635 | 7262 | 22797 | |
Assoc. Degree | 322 | 2905 | 8314 | |
Bachelors Degree | 1411 | 15940 | 48123 | |
Higher Degree | 978 | 9691 | 29215 | |
Total Housing Units | 2,950 | 29,421 | 87,076 | |
--Owner-Occupied | 889 | 14,836 | 46,112 | |
--Renter-Occupied | 1,696 | 12,229 | 34,846 | |
Owner-Occupied Values | < 100K | 13 | 541 | 1656 |
100-199K | 204 | 4527 | 15189 | |
200-299K | 281 | 4252 | 13371 | |
300-399K | 175 | 2430 | 7512 | |
400-499K | 75 | 1628 | 3729 | |
500K+ | 142 | 1458 | 4655 | |
Total Working Age Population | 4,436 | 48,512 | 148,684 | |
In Work Force | 3,368 | 34,402 | 106,059 | |
Not In Work Force | 1,068 | 14,110 | 42,625 | |
Workforce Employed | 3,244 | 33,271 | 102,411 | |
Workforce Unemployed | 123 | 1,090 | 3,574 | |
Civlian Workforce | 3,368 | 34,361 | 105,985 | |
Military Workforce | 0 | 41 | 75 | |
Total Households | 2,585 | 27,064 | 80,959 | |
Family Households | 925 | 13,711 | 43,055 | |
Non-Family Households | 1,660 | 13,353 | 37,904 | |
Married Couple | 730 | 11,308 | 34,197 | |
Other Family | 195 | 2,403 | 8,858 | |
Married w/Child | 204 | 3,809 | 12,742 | |
Single Male w/Child | 2 | 200 | 1,209 | |
Single Female w/Child | 104 | 1,064 | 4,051 |
Population Change Last Two Decades - Plus Projection
2000 | % | 2010 | % | 2020 | % | 2030 | |
---|---|---|---|---|---|---|---|
Indiana | 6,080,485 | +7 | 6,483,802 | +4 | 6,738,573 | +4 | 7,014,880 |
Hamilton County | 182,740 | +50 | 274,569 | +25 | 343,179 | +22 | 417,754 |
Marion County | 860,454 | +5 | 903,393 | +7 | 963,732 | +4 | 1,001,231 |
Total Working Age Population:
Total Households:
Total Working Age Population:
Total Households:
Total Working Age Population:
Total Households: